Dual Check Safety Operators manual Page 167
Operators manual
B-63494EN/02 9.DIAGNOSIS
- 161 -
(2) Data when an alarm is issued
<1> General
[Page 1]
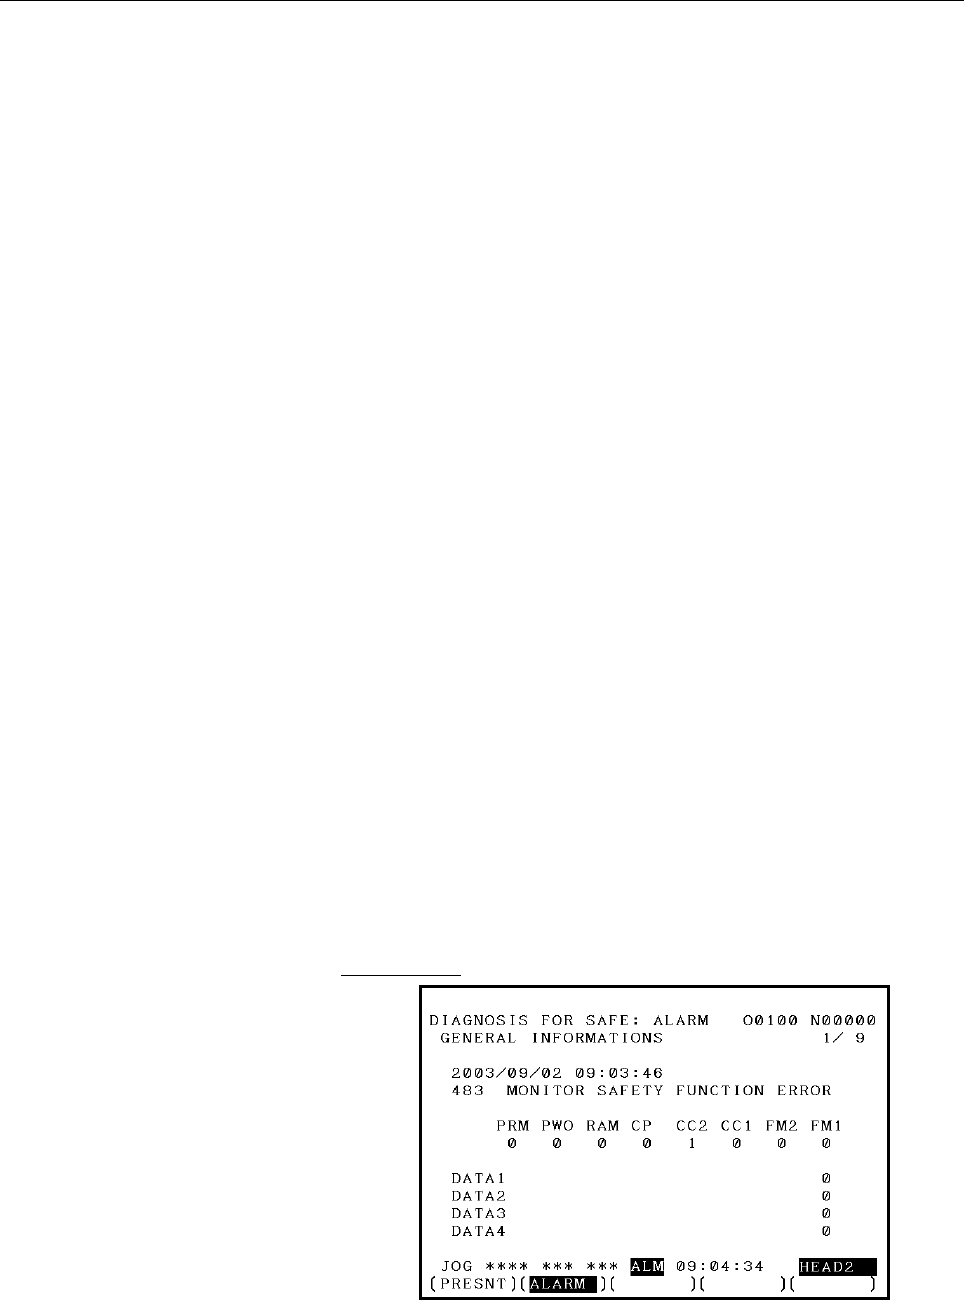
• For the first detected alarm related to dual check safety, the date
and time of alarm issue, alarm number, and message are
displayed.
• If no alarm is issued yet, "NO ALARM" is displayed, and "0" is
displayed for the other data items.
• The alarm display targets are:
SV410, SV411, SV470-SV498
SP755/765/775/785-SP757/767/777/787
Alarm 69, Alarm 72, Alarm 76, Alarm 77, Alarm 78
• The alarms related to display safety function error causes are:
SV483, SV484, SV490, SP755/765/775/785
• PRM, PWO, and so on display safety function error causes.
FM1 : It was detected that part of the safety function was not
executed. (Flow monitoring alarm).
FM2 : The other CPU detected that part of the safety function
was not executed. (Flow monitoring alarm)
CC1 : The result of a safety function check does not match the
result of a safety function check made by the other CPU.
(Cross-check alarm)
CC2 : The result of a safety function check does not match the
result of a safety function check made by the other CPU.
(Cross-check alarm)
CPU : An error occurred in a CPU self-test.
RAM : An error occurred in a RAM test.
PWO : An error occurred in a self-test at power-on time.
PRM : An error occurred in safety parameter transfer.
• DATA1-4 indicate flow counters and parameter numbers. (The
display data depends on the alarm.)
• The alarms related to the display of DATA1-4 are:
SV488, SV489, SV490, SV497, SP755, Spindle alarm 76
When spindle alarm 76 is issued, "-" is displayed if the spindle
does not support the diagnosis screen.
Screen layout
Contents Summary of Dual Check Safety Operators manual
- Page 1FANUC Series 16*/160*/160*s-MODEL B FANUC Series 18*/180*/180*s-MODEL B FANUC Series 21*/210*/210*s-MODEL B Dual Check Safety OPERATOR’S MANUAL B-63494EN/02
- Page 2B-63494EN/02 TABLE OF CONTENTS TABLE OF CONTENTS DEFINITION OF WARNING, CAUTION, AND NOTE .................................s-1 1 OVERVIEW ............................................................................................. 1 1.1 DIRECTIVE AND STANDARDS ......................................
- Page 3TABLE OF CONTENTS B-63494EN/02 3.9.1 Sequence of the Programmable Safe-Related I/O Signal Function........................36 3.9.2 C Language Executor .............................................................................................38 3.10 SAFETY POSITION SWITCH SIGNAL ..................
- Page 4B-63494EN/02 TABLE OF CONTENTS 6.4.2 Simple Electronic Gear Box and Electronic Gear Box 2-pair..............................126 6.4.3 Multi-path Control................................................................................................126 6.4.4 Closed Loop Control ......................
- Page 5TABLE OF CONTENTS B-63494EN/02 10.2.2 Guard Open Request Signal (ORQ) .....................................................................171 10.2.3 Test Mode Signal (OPT) ......................................................................................171 10.2.4 Guard Unlock Signal (*LGD), Gu
- Page 6B-63494EN/02 TABLE OF CONTENTS 11.6.3 Signals ..................................................................................................................206 11.6.3.1 Details on signals............................................................................................. 206 11.6.3.2 Si
- Page 7B-63494EN/02 1.OVERVIEW 1 OVERVIEW Setup for machining, which includes attaching and detaching a workpiece to be machined, and moving it to the machining start point while viewing it, is performed with the protection door opened. The dual check safety function provides a means for ensuring a high le
- Page 81.OVERVIEW B-63494EN/02 1.1 DIRECTIVE AND STANDARDS 1.1.1 Directives Machine tools and their components must satisfy the EC directives listed below. The FANUC CNC systems with the dual check safety function are compatible with all of these directives. Directive Directive 98/37/EC 1998 Safety of mach
- Page 9B-63494EN/02 1.OVERVIEW 1.2 DEFINITION OF TERMS 1.2.1 General Definition of Terms Reliability and safety Reliability and safety are defined by EN292-1 as follows: Term Definition Reliability Capability of a machine, machine component, or equipment to perform its required function under a specified c
- Page 101.OVERVIEW B-63494EN/02 1.3 BASIC PRINCIPLE OF DUAL CHECK SAFETY 1.3.1 Features of Dual Check Safety Dual Check Safety function has the following features. • Two-channel configuration with two or more independent CPUs • Cross-check function for detecting latent errors Detection A servo motor detecto
- Page 11B-63494EN/02 1.OVERVIEW 1.3.2 Compliance with the Safety Standard (EN954-1, Category 3) The dual check safety function satisfies the requirements of Category 3 of the safety standard EN954-1. Category 3 requires the following: • The safety function of a safety-related portion must not degrade when a
- Page 121.OVERVIEW B-63494EN/02 Output signal safety A signal is output (via two paths) to the relay used to shut off the power to the motor drive circuit. An error is detected by a MCC off Test. For detection of built-up failures, a MCC off Test needs to be conducted at certain intervals. This MCC off Test
- Page 13B-63494EN/02 1.OVERVIEW 1.3.2.3 MCC off Test The MCC is shut off using two CPUs: a CNC CPU and monitor CPU. To detect a latent error in the MCC shutoff paths forcibly, a MCC off Test is conducted. This test is essential to dual check safety. A MCC off Test must be conducted at specified times (after
- Page 141.OVERVIEW B-63494EN/02 1.3.2.5 Remaining risks The machine tool builder is to make a failure analysis in connection with the control system and determine the remaining risks of the machine. The dual check safety function has the following remaining risks: • The safety function is not active until t
- Page 15B-63494EN/02 1.OVERVIEW • Amplifiers (drive power modules) and motors must always be replaced by the same equipment type or else the parameters will no longer match the actual configuration and cause Dual check Safety to respond incorrectly. • There is a parameter that MCC off test is not to be made
- Page 161.OVERVIEW B-63494EN/02 1.4 GENERAL INFORMATION The following requirements must be fulfilled for the Dual-Check System: • All conditions of the certification report has to be respected. • The procedures for the changes in the System (either HW or SW) should be referred to maintenance manual (B-63005
- Page 17B-63494EN/02 1.OVERVIEW [CNC SE INTERFACE COURSE] Training course offered to the engineers who design CNC machine tools or CNC application system for the first time. This course is also suitable for customers who provide to retrofitting, to develop an original CNC machine tools or new application of
- Page 182.SYSTEM CONFIGURATION B-63494EN/02 2 SYSTEM CONFIGURATION The dual check safety function has the following components. Applicable CNC FANUC Series 16i/18i/21i/160is/180is/210is/160i/180i/210i (LCD-mounted type) FANUC Series 16i/18i/21i/160is/180is/210is/160i/180i/210i (stand-alone type) Number of c
- Page 19B-63494EN/02 2.SYSTEM CONFIGURATION I/O • I/O unit (I/O Link) • I/O module (FSSB) Software • Dual Check Safety software option Detector system - Feed axis detector • α Pulsecoder • αi Pulsecoder • β Pulsecoder • βi Pulsecoder • Separate detector - Spindle detector • M sensor • MZ sensor • BZ sensor
- Page 203.SAFETY FUNCTIONS B-63494EN/02 3 SAFETY FUNCTIONS - 14 -�
- Page 21B-63494EN/02 3.SAFETY FUNCTIONS 3.1 APPLICATION RANGE The dual check safety function assumes the following configuration: A) One protective door is provided. B) If the protective door is closed, safety is assured. C) One safety area is provided. However, up to four protective doors with a lock can b
- Page 223.SAFETY FUNCTIONS B-63494EN/02 Safe machine position monitoring This function checks that the position on a servo axis is within a specified range, using two CPUs in redundant mode. If a position exceeding the range is detected, the system judges that an abnormal event has occurred. If an abnormal
- Page 23B-63494EN/02 3.SAFETY FUNCTIONS The safe speed of the spindle motor is checked by the CNC CPU and spindle CNC CPU in redundant mode. Dual monitoring of emergency stop signal Emergency Spindle stop CPU CNC Cross-check Spindle Dual monitoring of protective door state CPU motor SPM Protective door Prot
- Page 243.SAFETY FUNCTIONS B-63494EN/02 Programmable safe-related I/O signals For use by the machine tool builder for an arbitrary purpose, 16 points of input signals and 8 points of output signals are available. These signals are monitored in dual mode. By using the C language executor and the PMC ladder f
- Page 25B-63494EN/02 3.SAFETY FUNCTIONS 3.2 BEFORE USING THE SAFETY FUNCTION 3.2.1 Important Items to Check Before Using the Safety Function When using the safety function for the first time upon assembly of the machine, replacing a part, or changing a safety parameter (such as a safety speed or safe range
- Page 263.SAFETY FUNCTIONS B-63494EN/02 3.3 STOP 3.3.1 Stopping the Spindle Motor Because the spindle motor is an induction type motor, power-down during rotation causes the motor to continue rotating for a certain amount of time. From a safety standpoint, the motor may have to be stopped immediately. If th
- Page 27B-63494EN/02 3.SAFETY FUNCTIONS 3.3.2 Stopping the Servo Motor Because the servo motor is a synchronous motor, power-down results in a dynamic brake stop. The dynamic brake stop is electric braking in which the excited rotor is isolated from the power source and the generated electric energy is used
- Page 283.SAFETY FUNCTIONS B-63494EN/02 Controlled stop state The power to the motor is not shut off. The servo motor and the spindle motor are controlled to stop. In the controlled stop state of either motor, the safety function is active if the condition for enabling the safety function is satisfied (the
- Page 29B-63494EN/02 3.SAFETY FUNCTIONS 3.4 SAFE-RELATED I/O SIGNAL MONITORING A set of safe-related I/O signals are connected to the I/O Link and the servo FSSB through separate paths. The two independent CPUs individually check the input signals. If a mismatch between two corresponding signals is found, t
- Page 303.SAFETY FUNCTIONS B-63494EN/02 This section briefly describes the signals. For details, see Chapter 5, "OPERATION." For specific connections, see the sample system configuration in Chapter 10. CNC Machine I/O UNIT DI I/O LINK CNC DO CPU Cross check FSSB I/O DI FSSB Monitor DO CPU Duplicated I/O Sym
- Page 31B-63494EN/02 3.SAFETY FUNCTIONS Safe-related I/O 1. *ESP Emergency stop signal (input) Emergency stop signal. The signal is monitored in redundant mode. The signal is connected to the *ESP input of the servo amplifier as well. 2. SGDn Guard state signal (input) The signal is provided for double moni
- Page 323.SAFETY FUNCTIONS B-63494EN/02 Signals other than safe-related I/O The following signals are not safe-related signals (are not checked in redundant mode) but are important signals in the system. The machine tool builder must create an appropriate Ladder program. IMPORTANT The Ladder program cannot
- Page 33B-63494EN/02 3.SAFETY FUNCTIONS Guard open request signal and guard unlock signal CNC (PMC) Door open request 24V X G Protective door Ladder ORQ ORQ-I F Y LGD Ladder LGD-O The figure shows a sample connection of the protective door open request switch and the guard unlock signal. In the normal state
- Page 343.SAFETY FUNCTIONS B-63494EN/02 Timing diagram from door close state to door open state The following diagram shows the timings at which the door is opened and closed again. ORQ_P ORQ *LGD *LGD_P1 (Actual door unlock signal) SGD_P SGD2 Door closed Door closed Actual door status Door opened t (1) (2)
- Page 35B-63494EN/02 3.SAFETY FUNCTIONS 3.5 EMERGENCY STOP The emergency stop signal is monitored in redundant mode. When the emergency stop is input, the servo motor slows down to a stop (*) and enters the dynamic brake stop. The spindle slows down to a stop(*) as instructed by the PMC, and the power is sh
- Page 363.SAFETY FUNCTIONS B-63494EN/02 3.6 SAFE SPEED MONITORING When the guard open request signal is input, the dual check safety function starts monitoring whether a safety speed is kept on each feed axis and spindle. If the speed does not exceed the safety speed range and if the machine position is in
- Page 37B-63494EN/02 3.SAFETY FUNCTIONS IMPORTANT 3 Before inputting the guard open request signal, reduce each axial speed and spindle speed to a safety speed range or below. If a speed exceeds the limit, the guard open request signal is not accepted (the door is not unlocked). If the door is forced open,
- Page 383.SAFETY FUNCTIONS B-63494EN/02 3.7 SAFE MACHINE POSITION MONITORING While the door is open, the dual check safety function checks whether the position on each feed axis is within the safe machine position range defined by safety parameters. If it detects a machine position beyond the safety range,
- Page 39B-63494EN/02 3.SAFETY FUNCTIONS At power-on, the safety function does not work. After power-on, the CNC checks whether a reference position return is completed. If the reference position return is completed and if the protective door is open, safe machine position monitoring and safety speed monitor
- Page 403.SAFETY FUNCTIONS B-63494EN/02 3.8 MCC OFF TEST A MCC off Test must be carried out in intervals of 24 hours, so that the safety functions would not be damaged by a possible cause of failure. A message telling that the MCC off Test must be carried out is displayed at power-on or when 24 hours have e
- Page 41B-63494EN/02 3.SAFETY FUNCTIONS Timing chart of MCC off Test During test MCC test start (User signal) Brake on Vertical axis brake 500 ms or more Test mode signal OPT (G191#2) Servo-off signal SVF8-1(G126#7-0) MCC off Test execution MCC off Test being request signal RQT executed (F191#2) Power outag
- Page 423.SAFETY FUNCTIONS B-63494EN/02 3.9 PROGRAMMABLE SAFE-RELATED I/O SIGNALS 3.9.1 Sequence of the Programmable Safe-Related I/O Signal Function CNC C language executor User logic [f] Monitor [g] [k] speed/ position, Monitor General output signal (8 points) etc. safe-related [l] output signal Monitor F
- Page 43B-63494EN/02 3.SAFETY FUNCTIONS The programmable safe-related I/O signal function operates according to the sequence described below. See the figure (outline of this function) provided on the previous page. [a] The safe-related input signals (*ESP, *SMC, GDL, SGDn, ORQn, OPT, safety speed/safety pos
- Page 443.SAFETY FUNCTIONS B-63494EN/02 Monitoring of abnormal state If a mismatch between the state of the signal posted via the PMC and the state of the signal posted via the FSSB lasts for a certain period of time or more, the occurrence of a safety-related error is assumed. The CNC CPU and the monitor C
- Page 45B-63494EN/02 3.SAFETY FUNCTIONS (3) Input of actual speed (F) on a controlled axis (4) Input of actual spindle speed (S) (5) Input of an absolute position on a controlled axis (6) Input of a machine position on a controlled axis (7) Input of a relative position on a controlled axis (8) Input of a di
- Page 463.SAFETY FUNCTIONS B-63494EN/02 (16) Reading of programmable safe-related input signals This function is equivalent to the pmc_rdsafeprgio() function. [Input] Function code iodate[0] = 136 Data length iodata[2] = 0 Data number iodata[3] = 0 Data attribute iodata[4] = 0 [Output] Completion code iodat
- Page 47B-63494EN/02 3.SAFETY FUNCTIONS Reading of programmable safe-related input signals [Function name] pmc_rdsafeprgio [Format] #include
int pmc_rdsafeprgio( int datano , struct iodbsaftyprg *buf ) ; struct iodbsaftyprg { int datano ; /* Data number */ int dummy ; /* Not used */ char cdata[2 - Page 483.SAFETY FUNCTIONS B-63494EN/02 Writing of programmable safe-related output signals [Function name] pmc_wrsafeprgio [Format] #include
int pmc_wrsafeprgio( char data ) ; [Argument] data : Programmable safe-related output signal data [Return value] 0 : Normal termination 6 : The dual check - Page 49B-63494EN/02 3.SAFETY FUNCTIONS 3.10 SAFETY POSITION SWITCH SIGNAL Output of safety position switch signals When the machine position on a controlled axis is within the allowable range set in safety parameters, a safety position switch signal is output. 1 0 Parameter-set value Parameter-set value •
- Page 503.SAFETY FUNCTIONS B-63494EN/02 Assignment of signals to controlled axes Safety position switch signals can be assigned to arbitrary controlled axes (even the maximum allowable number of points can be assigned to one axis). The safety parameters (No. 13880 to No. 13911) are used for assignment to ax
- Page 51B-63494EN/02 4.INSTALLATION 4 INSTALLATION Except FSSB I/O module, the hardware installation such as field wiring, power supply, etc. should be referred to connection manual (B-63003EN) for CNC units and (B-65162E) for servo amplifier. EMC problem should be referred to EMC guideline manual (A-72937/
- Page 524.INSTALLATION B-63494EN/02 Environmental conditions for servo amplifier The servo amplifier α series must be installed in a sealed type cabinet to satisfy the following environmental requirements: (1) Ambient Temperature Ambient temperature of the unit : 0 to 55°C (at operation) -20 to 60°C (at kee
- Page 53B-63494EN/02 4.INSTALLATION 4.1 OVERALL CONNECTION DIAGRAM 4.1.1 For 1-path Mother board LCD display unit 24V-IN(CP1A) 24 VDC power supply 24V-OUT(CP1B) To I/O device MDI UNIT Soft key cable CK2 MDI(CA55) CK1 R232(JD36A) RS-232C I/O device R232(JD36B) RS-232C I/O device Touch panel HDI(JA40) High-sp
- Page 544.INSTALLATION B-63494EN/02 Mother board LCD display unit SPDL(JA41) JA7B JY2 SPM JA7A TB2/CZ2 Serial spindle motor Second spindle FSSB(COP10A) COP10B TB2 Axis 1 SVM servo motor COP10A JF1 COP10B TB2 Axis 2 SVM servo monitor COP10A JF1 COP10B TB2 Axis 3 SVM servo motor COP10A JF1 (This diagram assum
- Page 55B-63494EN/02 4.INSTALLATION 4.1.2 For 2-path Main board I/O module for Machine operator’s panel operator’s panel I/O Link (JD44A) JD1B CE56 JD1A CE57 I/O module for Power connector panel magnetics cabinet JD1B CB150 JD1A To next I/O unit Safe-related and other signals PSM 200VAC 2φ MCC CX1A CX3 200V
- Page 564.INSTALLATION B-63494EN/02 From previous SVM (COP10A) Separate detector interface unit COP10B JF101 Separate detector COP10A JF102 Separate detector JF103 Separate detector JF104 Separate detector JA4A Battery Safe-related signals FSSB I/O module Power magnetics CB155A cabinet COP10B CB156A COP10A
- Page 57B-63494EN/02 4.INSTALLATION Sub CPU board TB1 CXA2B SPM SPDL (JA41) JA7B JYA2 JA7A TB2/CZ2 Spindle motor TB1 CXA2A To next SPM (JA7B) TB1 CXA2B Axis control card SVM1 FSSB (COP10A-1) COP10B JF1 COP10A CZ2 Servo motor To next SVM (COP10B) From previous SVM (COP10A) Separate detector interface unit CO
- Page 584.INSTALLATION B-63494EN/02 4.1.3 Loader Control Loader control board TB1 CXA2B Axis control card SVM1 FSSB (COP10A-1) COP10B JF1 COP10A CZ2 Servo motor To next SVM (COP10B) From previous SVM (COP10A) Separate detector interface unit COP10B JF101 Separate detector COP10A JF102 Separate detector JF10
- Page 59B-63494EN/02 4.INSTALLATION 4.2 DI/DO CONNECTION (VIA THE PMC) For DI/DO signals connected via the PMC, the I/O signals of the unit connected to the FANUC I/O Link are to be input to or output from the following addresses, via the PMC: For the layout and descriptions of the signals, see Chapter 5, "
- Page 604.INSTALLATION B-63494EN/02 4.3 DI/DO CONNECTION (VIA THE FSSB) For DI/DO signals connected via the FSSB, the I/O signals are to be directly connected to the I/O unit connected to the FSSB. 4.3.1 FSSB I/O Connection Power supply connection External power supply CP11A 24 VDC stabilized 1 +24V power s
- Page 61B-63494EN/02 4.INSTALLATION DI/DO connection (1) Connector specifications Adherence to the MIL-C-83503 standard With improper insertion prevention key (2) Connector pin numbers Printed circuit board insertion direction Improper insertion Top view prevention key Pin mark The array closer to the impro
- Page 624.INSTALLATION B-63494EN/02 +24E RV RV RV RV RV RV RV RV DOCOM +24V 0V +24V stabilized power supply Relay DV DV Relay DV Relay DV Relay DV Relay DV Relay DV Relay DV Relay - 56 -�
- Page 63B-63494EN/02 4.INSTALLATION Signal list - Basic unit (1) DI signals #7 #6 #5 #4 #3 #2 #1 #0 DI+000 155A-B05 155A-A06 155A-B04 155A-A04 155A-B03 155A-A03 155A-B02 155A-A02 #7 #6 #5 #4 #3 #2 #1 #0 DI+001 155A-B10 155A-A10 155A-B09 155A-A09 155A-B08 155A-A08 155A-B07 155A-A07 #7 #6 #5 #4 #3 #2 #1 #0 DI
- Page 644.INSTALLATION B-63494EN/02 Machine interface - Basic unit FSSB I/O module CB155A CB156A 34-pin ribbon cable connector A B A B 01 +24E +24E 01 +24E +24E 02 DI+000 #0 DI+000 #1 02 DI+002 #0 DI+002 #1 03 DI+000 #2 DI+000 #3 03 DI+002 #2 DI+002 #3 04 DI+000 #4 DI+000 #5 04 DI+002 #4 DI+002 #5 05 DI+000
- Page 65B-63494EN/02 4.INSTALLATION - Extension unit FSSB I/O module CB155B CB156B 34-pin ribbon cable connector A B A B 01 +24E +24E 01 +24E +24E 02 DI+004 #0 DI+004 #1 02 DI+006 #0 DI+006 #1 03 DI+004 #2 DI+004 #3 03 DI+006 #2 DI+006 #3 04 DI+004 #4 DI+004 #5 04 DI+006 #4 DI+006 #5 05 DI+004 #7 05 DI+006
- Page 664.INSTALLATION B-63494EN/02 Connecting the basic unit with an extension unit Make a connection between the basic unit and extension unit by using a flat cable as shown below. The length of the flat cable is 100 mm. Units viewed from top Basic unit Extension unit Mounting plane CNF1 CNF2 Marking ▼ ma
- Page 67B-63494EN/02 4.INSTALLATION 4.3.2 FSSB I/O Attachment External dimensions NOTE The figure above shows the outline drawing of the basic unit. An extension unit has the same outside dimensions. CNF1(basic) CP11A CNF2(extension) Fuse FUSE1 CP11B Left : CB156A Right : CB155A COP10A COP10B NOTE The figur
- Page 684.INSTALLATION B-63494EN/02 Screw attachment 2-M4 Basic unit Extension unit 39 84 70 to 80 Mounting hole machining diagram When using both of the basic unit and an extension unit, provide a space of 70 mm to 80 mm between the mounting holes as shown above. - 62 -�
- Page 69B-63494EN/02 4.INSTALLATION CAUTION When attaching/detaching this unit, a screwdriver is inserted at an angle. So, a sufficiently large working space must be provided on the both sides of this unit. As a guideline, if the front surface of an adjacent unit is flush with or set back from the front sur
- Page 704.INSTALLATION B-63494EN/02 Attachment to a DIN rail Attachment DIN rail Detachment DIN rail Attachment 1. Hook the unit over the top of the DIN rail. 2. Press the unit down until it snaps into place. Detachment 1. Pull down the lock section with a standard screwdriver. 2. Pull the lower part of the
- Page 71B-63494EN/02 4.INSTALLATION Notes on installation 1. Use the unit in a completely sealed cabinet. 2. Be sure to install the unit on a vertical plane and provide a space of 100 mm or more above and under the unit. Under the unit, do not place a device that produces much heat. 3. When using the basic
- Page 724.INSTALLATION B-63494EN/02 4.3.3 FSSB I/O Specification List Installation conditions Ambient temperature Operating 0°C to 55°C of the unit Storage, transportation -20°C to 60°C Temperature variation 1.1°C /minute maximum Normally Relative humidity 75% or less Humidity Short term (no more than one m
- Page 73B-63494EN/02 5.I/O SIGNALS 5 I/O SIGNALS - 67 -�
- Page 745.I/O SIGNALS B-63494EN/02 5.1 OVERVIEW The dual check safety function provides two input paths and two output paths for safe-related signals (safety signals). For input signals (safety input signals), two paths are used: one path for input to the CNC via the PMC, and the other for input to the moni
- Page 75B-63494EN/02 5.I/O SIGNALS 5.2 SIGNALS Emergency stop signal *ESP1
- Page 765.I/O SIGNALS B-63494EN/02 The timing chart of signals related to MCC off Test mode is shown below. 1 RQT 0 1 OPT 0 1 0 MCF1 1 0 1 SMC1 0 1 SMC2 0 Test No. DGN379 1 2 3 4 0 CAUTION 1 While the MCC off test processing is in progress, avoid bringing the test mode signal (OPT) to 0. 2 If multi-path con
- Page 77B-63494EN/02 5.I/O SIGNALS Test No. 1 2 3 4 5 MCF1 (PMC) MCF2 (FSSB) *SMC1 (PMC) *SMC2 (FSSB) Timer limit Timer Test start Test completion Example 1) Timing chart 1 of MCC off test (normal state) Test No. 1 2 3 4 MCF1 (PMC) MCF2 (FSSB) *SMC1 (PMC) *SMC2 (FSSB) Timer limit Alarm !! Timer Test start E
- Page 785.I/O SIGNALS B-63494EN/02 Guard open request signal ORQ
- Page 79B-63494EN/02 5.I/O SIGNALS Guard lock state signal GDL1
- Page 805.I/O SIGNALS B-63494EN/02 MCC-on enable signal MCF1
- Page 81B-63494EN/02 5.I/O SIGNALS CAUTION 1 If the current date and time lags behind the date and time of the previously completed MCC off Test due to a clock change or the like, it is assumed that 24 hours have elapsed since the previous MCC off Test. 2 From February 28 to March 1, the elapse of 24 hours
- Page 825.I/O SIGNALS B-63494EN/02 Safety brake output signal SA
- Page 83B-63494EN/02 5.I/O SIGNALS WARNING When using the safety brake output signals, be sure to set the VRDY OFF alarm ignore signals for all axes (IGNVRY, G066#0) and the VRDY OFF alarm ignore signal (IGVRYx, G192) for each axis to 0. CAUTION Be sure to inspect the brake periodically. Programmable safe-r
- Page 845.I/O SIGNALS B-63494EN/02 Safety speed / safety position selection signal A SVA1 to SVA8
- Page 85B-63494EN/02 5.I/O SIGNALS CAUTION 1 The safety speed and safety position selection signal are safety signals, so that these signals are input via the two paths, namely, via the PMC and FSSB. Each signal input via the two paths is monitored for a mismatch by the CNC and monitor in dual mode. 2 When
- Page 865.I/O SIGNALS B-63494EN/02 If a mismatch between the state of the signals (F336 to F339) output via the PMC and the signals (DO+002 to DO+005) output via the FSSB lasts for a certain period of time, the CNC CPU and monitor CPU assume the occurrence of an error and immediately shut off power to the m
- Page 87B-63494EN/02 5.I/O SIGNALS 5.3 SIGNAL ADDRESSES 5.3.1 1-path Control Via the PMC #7 #6 #5 #4 #3 #2 #1 #0 X008 *ESP1 G008 *ESPG G191 *SMC1 GDL1 SGD1 ORQ OPT G332 SGD41 SGD31 SGD21 G334 SDI07 SDI06 SDI05 SDI04 SDI03 SDI02 SDI01 SDI00 G335 SDI15 SDI14 SDI13 SDI12 SDI11 SDI10 SDI09 SDI08 G336 SVA8 SVA7
- Page 885.I/O SIGNALS B-63494EN/02 Via the FSSB #7 #6 #5 #4 #3 #2 #1 #0 DI+000 SGD42 SGD32 SGD22 *ESP2 DI+001 *SMC2 GDL2 SGD2 Basic DI+002 SDI07 SDI06 SDI05 SDI04 SDI03 SDI02 SDI01 SDI00 DI+003 SDI15 SDI14 SDI13 SDI12 SDI11 SDI10 SDI09 SDI08 DI+004 SVA8 SVA7 SVA6 SVA5 SVA4 SVA3 SVA2 SVA1 Extension DI+005 SV
- Page 89B-63494EN/02 5.I/O SIGNALS 5.3.2 2-CPU 2-path Control (Series 16i/18i-TB, Series 16i-MB) A signal symbol suffixed with #1 represents a signal dedicated to tool post 1, and a signal symbol suffixed with #2 represents a signal dedicated to tool post 2. Via the PMC #7 #6 #5 #4 #3 #2 #1 #0 X008 *ESP1 #7
- Page 905.I/O SIGNALS B-63494EN/02 #7 #6 #5 #4 #3 #2 #1 #0 #1 F000 SA #1 #1 #1 F191 RQT MCF1 *LGD #1 #1 #1 #1 #1 #1 #1 #1 G331 SDO07 SDO06 SDO05 SDO04 SDO03 SDO02 SDO01 SDO00 #1 #1 #1 #1 #1 #1 #1 #1 F336 SPS08 SPS07 SPS06 SPS05 SPS04 SPS03 SPS02 SPS01 #1 #1 #1 #1 #1 #1 #1 #1 F337 SPS16 SPS15 SPS14 SPS13 SPS
- Page 91B-63494EN/02 5.I/O SIGNALS Via the FSSB Signals input to the FSSB I/O module connected to tool post 1/signals output from the FSSB I/O module #7 #6 #5 #4 #3 #2 #1 #0 #1 #1 #1 #1 DI+000 SGD42 SGD32 SGD22 *ESP2 #1 #1 #1 DI+001 *SMC2 GDL2 SGD2 Basic #1 #1 #1 #1 #1 #1 #1 #1 DI+002 SDI07 SDI06 SDI05 SDI0
- Page 925.I/O SIGNALS B-63494EN/02 5.3.3 1-CPU 2-path Control (Series 16i/18i-TB) A signal symbol suffixed with #1 represents a signal dedicated to tool post 1, and a signal symbol suffixed with #2 represents a signal dedicated to tool post 2. Via the PMC #7 #6 #5 #4 #3 #2 #1 #0 X008 *ESP1 #7 #6 #5 #4 #3 #2
- Page 93B-63494EN/02 5.I/O SIGNALS #7 #6 #5 #4 #3 #2 #1 #0 #1 F000 SA #1 #1 #1 F191 RQT MCF1 *LGD #1 #1 #1 #1 #1 #1 #1 #1 G331 SDO07 SDO06 SDO05 SDO04 SDO03 SDO02 SDO01 SDO00 #1 #1 #1 #1 #1 #1 #1 #1 F336 SPS08 SPS07 SPS06 SPS05 SPS04 SPS03 SPS02 SPS01 #1 #1 #1 #1 #1 #1 #1 #1 F337 SPS16 SPS15 SPS14 SPS13 SPS
- Page 945.I/O SIGNALS B-63494EN/02 Via the FSSB #7 #6 #5 #4 #3 #2 #1 #0 DI+000 SGD42 SGD32 SGD22 *ESP2 DI+001 *SMC2 GDL2 SGD2 Basic #1 #1 #1 #1 #1 #1 #1 #1 DI+002 SDI07 SDI06 SDI05 SDI04 SDI03 SDI02 SDI01 SDI00 #1 #1 #1 #1 #1 #1 #1 #1 DI+003 SDI15 SDI14 SDI13 SDI12 SDI11 SDI10 SDI09 SDI08 #2 #2 #2 #2 #1 #1
- Page 95B-63494EN/02 5.I/O SIGNALS 5.3.4 2-CPU 3-path Control (Series 16i-TB) A signal symbol suffixed with #1 represents a signal dedicated to tool post 1, a signal symbol suffixed with #2 represents a signal dedicated to tool post 2, and a signal symbol suffixed with #3 represents a signal dedicated to to
- Page 965.I/O SIGNALS B-63494EN/02 #7 #6 #5 #4 #3 #2 #1 #0 #1 F000 SA #1 #1 #1 F191 RQT MCF1 *LGD #1 #1 #1 #1 #1 #1 #1 #1 G331 SDO07 SDO06 SDO05 SDO04 SDO03 SDO02 SDO01 SDO00 #1 #1 #1 #1 #1 #1 #1 #1 F336 SPS08 SPS07 SPS06 SPS05 SPS04 SPS03 SPS02 SPS01 #1 #1 #1 #1 #1 #1 #1 #1 F337 SPS16 SPS15 SPS14 SPS13 SPS
- Page 97B-63494EN/02 5.I/O SIGNALS Via the FSSB Signals input to the FSSB I/O module connected to tool post 1/signals output from the FSSB I/O module #7 #6 #5 #4 #3 #2 #1 #0 #1 #1 #1 #1 DI+000 SGD42 SGD32 SGD22 *ESP2 #1 #1 #1 DI+001 *SMC2 GDL2 SGD2 Basic #1 #1 #1 #1 #1 #1 #1 #1 DI+002 SDI07 SDI06 SDI05 SDI0
- Page 985.I/O SIGNALS B-63494EN/02 Signals input to the FSSB I/O module connected to tool post 2/signals output from the FSSB I/O module #7 #6 #5 #4 #3 #2 #1 #0 (*) (*) (*) (*) DI+000 SGD42 SGD32 SGD22 *ESP2 (*) (*) (*) DI+001 *SMC2 GDL2 SGD2 Basic #2 #2 #2 #2 #2 #2 #2 #2 DI+002 SDI07 SDI06 SDI05 SDI04 SDI0
- Page 99B-63494EN/02 5.I/O SIGNALS 5.3.5 Loader Control (Series 16i/18i/21i-TB, Series 16i/18i-MB) All of the signals described in this subsection are dedicated to the loader. Via the PMC #7 #6 #5 #4 #3 #2 #1 #0 X000 *ESP1 #7 #6 #5 #4 #3 #2 #1 #0 G008 *ESPG G191 *SMC1 GDL1 SGD1 ORQ OPT #7 #6 #5 #4 #3 #2 #1
- Page 1005.I/O SIGNALS B-63494EN/02 5.3.6 Caution (Common) CAUTION 1 The shaded signals are dual signals. (An italic signal is monitored in dual mode only when the safety function that uses the signal is enabled.) 2 Emergency stop signals (*ESP) via the PMC
- Page 101B-63494EN/02 5.I/O SIGNALS 5.4 SAFETY SIGNAL MODES Depending on the safety input signal state, the CNC, monitor, and spindle software internally have one of the six modes (safety signal modes) indicated in the table below. Safety signal mode Safety signal state Machine state Emergency stop mode *ESP
- Page 1025.I/O SIGNALS B-63494EN/02 CAUTION When multiple doors (to be set using parameter No. 13800) are used and a different mode is set for each door, the safety signal mode for the entire safety area is set in the priority order of mode D > mode C > mode B > mode A. For example, when safety signal mode D
- Page 103B-63494EN/02 5.I/O SIGNALS 5.5 NOTES ON MULTI-PATH CONTROL This section describes cautions about safe-related I/O signals that should be taken in multi-path control. 5.5.1 2-CPU 2-Path Control (without Axis Change between Paths) If there is no axis change between paths under 2-CPU 2-path control, a
- Page 1045.I/O SIGNALS B-63494EN/02 5.5.2 2-CPU 2-Path Control (with Axis Change between Paths) If there is an axis change between paths under 2-CPU 2-path control, a single group of safety areas can be provided. Two FSSB I/O units, that is one unit for each path, are required. (The two FSSB I/O units are re
- Page 105B-63494EN/02 5.I/O SIGNALS 5.5.3 1-CPU 2-Path Control A single group of safety areas can be provided under 1-CPU 2-path control. A single FSSB I/O unit is required. Two groups of safety input signals are cross-checked. The first group consists of a safety signal input to tool post 1 (DI1C: X008#4, G
- Page 1065.I/O SIGNALS B-63494EN/02 5.5.4 2-CPU 3-Path Control Under 2-CPU 3-path control, two groups of safety areas can be provided: one group for tool post 1 and the other group for tool posts 2 and 3. Two FSSB I/O units are required: one unit for tool post 1 and the other unit for tool posts 2 and 3. (Th
- Page 107B-63494EN/02 5.I/O SIGNALS 5.5.5 Loader Control A single group of safety areas can be provided for loader control, independently of that for the machine controlled with the main CPU board and sub-CPU board. Besides the FSSB unit for the machine, a single FSSB unit is required for the loader. (Even i
- Page 1086.PARAMETERS B-63494EN/02 6 PARAMETERS - 102 -�
- Page 109B-63494EN/02 6.PARAMETERS 6.1 OVERVIEW The parameters related to the dual check safety function (safety parameters) are protected by a code (No. 3225) for the safety parameters. The value of a safety parameter cannot be modified unless the same value as the code for the safety parameters is set as t
- Page 1106.PARAMETERS B-63494EN/02 6.2 PARAMETERS 1023 Servo axis number for each axis [Data type] Byte axis [Valid data range] 1, 2, 3, ..., number of controlled axes Set which servo axis corresponds to each controlled axis. Usually, set the same value for a controlled axis number and servo axis number. A c
- Page 111B-63494EN/02 6.PARAMETERS 1838 Positional deviation limit during movement for each axis in safety signal mode C [Data type] 2-word axis [Unit of data] Detection unit [Valid data range] 0 to 99999999 Set a positional deviation limit during movement for each axis in safety signal mode C (state in whic
- Page 1126.PARAMETERS B-63494EN/02 CAUTION Usually set the DCE = 1 in the dual check safety function. The system cannot start-up because MCC-on enable signal (MCF) = 0 when the DCE = 0. WARNING Always set bits 5 and 7 of parameter No.1902 to 0. If one of these bits is set "1", the safety functions may be exe
- Page 113B-63494EN/02 6.PARAMETERS 1942 Safety speed for each axis 13821 Safety speed 1 for each axis 13822 Safety speed 2 for each axis 13823 Safety speed 3 for each axis 13824 Safety speed 4 for each axis [Data type] 2-word axis [Unit of data] [Valid data range] Parameter Valid data range Increment TR2x Un
- Page 1146.PARAMETERS B-63494EN/02 CAUTION 1 When bit 1 (TR2x) of parameter No. 13802 is set to 0, a speed command check is made in terms of the detection unit. So, a calculation error can result. 2 Safety speed parameter No. 1942, and No. 13821 through No. 13824 are safety parameters, so that these paramete
- Page 115B-63494EN/02 6.PARAMETERS [Valid data range] -99999999 to 99999999 Set a safe machine position for each axis. The CNC and monitor always check the machine position on each linear axis in the dual check safety function. In safety signal mode B (state in which a guard open request is input, and the gu
- Page 1166.PARAMETERS B-63494EN/02 CAUTION 1 The checks are made on the basis of the machine position to the detection unit. Accordingly, a calculation error may occur. 2 Safe machine position parameter No. 1943, No. 1944, and No. 13831 through No. 13836 are safety parameters, so that these parameters are pr
- Page 117B-63494EN/02 6.PARAMETERS 1946 MCC off Test timer [Data type] Word [Unit of data] ms [Valid data range] 0 to 32767 When MCC off Test mode is set with the dual check safety function, the CNC conducts a safety output signal MCC off Test. If a MCC off Test is not completed within the time set in this p
- Page 1186.PARAMETERS B-63494EN/02 1950 Brake signal timer [Data type] Word [Unit of data] ms [Valid data range] 0 to 32767 Set a time period from when the monitor in the dual check safety function detects that the MCC contact state signal (*SMC2) is 0 (MCC on state) until the brake release signal (*BRK) goe
- Page 119B-63494EN/02 6.PARAMETERS 2078 Monitor conversion factor (numerator) of each axis 2079 Monitor conversion factor (denominator) of each axis [Data type] Word axis Set the following values. Number of position feedback pulses per motor revolution Conversion Numerator (Value multiplied by the feed gear)
- Page 1206.PARAMETERS B-63494EN/02 3225 Code for safety parameters [Data type] 2-word [Valid data range] 0 to 99999999 Set a code (password) for protecting against modifications to parameters related to the dual check safety function (safety parameters). When a code for safety parameters is set, the paramete
- Page 121B-63494EN/02 6.PARAMETERS 4372 Safe speed of each spindle 4438 Safe speed 2 of each spindle 4440 Safe speed 3 of each spindle 4442 Safe speed 4 of each spindle [Data type] Word [Unit of data] min-1 [Valid data range] 0 to 32767 Set a safety speed for each spindle in terms of motor speed. With the du
- Page 1226.PARAMETERS B-63494EN/02 #7 #6 #5 #4 #3 #2 #1 #0 13800 NM2 NM1 SAP CIO CAUTION 1 When these parameters are set, the power must be turned off before operation is continued. 2 These parameters are safety parameters, so that these parameters are protected using the key and code of Dual Check Safety. T
- Page 123B-63494EN/02 6.PARAMETERS #7 #6 #5 #4 #3 #2 #1 #0 13802 TR2x NP2x CAUTION 1 When these parameters are set, the power must be turned off before operation is continued. 2 These parameters are safety parameters, so that these parameters are protected using the key and code of Dual Check Safety. To modi
- Page 1246.PARAMETERS B-63494EN/02 CAUTION 1 This parameter is a safety parameter, so that the parameter is protected using the key and code of Dual Check Safety. To modify the parameter, set a code for safety parameters as the key for safety parameters (parameter No. 3226). 2 When 0 is set in this parameter
- Page 125B-63494EN/02 6.PARAMETERS CAUTION 1 When 0 is set, the safety position switch function of the corresponding number is not used. (The safe position switch signal of the corresponding number is not output.) 2 If an axis for which Dual Check Safety is disabled by setting bit 6 of parameter No. 1904 to
- Page 1266.PARAMETERS B-63494EN/02 13920 Maximum operation range of the 1st safe position switch 13921 Maximum operation range of the 2nd safe position switch … 13951 Maximum operation range of the 32nd safe position switch [Data type] 2-word [Unit of data] Increment system IS-A IS-B IS-C Unit Millimeter mac
- Page 127B-63494EN/02 6.PARAMETERS 13960 Minimum operation range of the 1st safe position switch 13961 Minimum operation range of the 2nd safe position switch … 13991 Minimum operation range of the 32nd safe position switch [Data type] 2-word [Unit of data] Increment system IS-A IS-B IS-C Unit Millimeter mac
- Page 1286.PARAMETERS B-63494EN/02 6.3 PARAMETERS RELATED TO THE USE OF FSSB I/O UNIT #7 #6 #5 #4 #3 #2 #1 #0 1902 FMD [Data type] Bit FMD The FSSB setting mode is: 0: Automatic setting mode. 1: Manual setting 2 mode. CAUTION When using the dual check safety function, set the FMD bit to 1, to select manual s
- Page 129B-63494EN/02 6.PARAMETERS #7 #6 #5 #4 #3 #2 #1 #0 1905 IO2 IO1 [Data type] Bit axis IO1 A first FSSB I/O unit is: 0: Not used. 1: Used. IO2 A second FSSB I/O unit is: 0: Not used. 1: Used. CAUTION 1 The FSSB I/O unit and separate detector interface unit (pulse module) are handled as units of the sam
- Page 1306.PARAMETERS B-63494EN/02 1910 Address conversion table value for slave 1 of FSSB channel 1 (ATR) : 1919 Address conversion table value for slave 10 of FSSB channel 1 (ATR) 1970 Address conversion table value for slave 1 of FSSB channel 2 (ATR) : 1979 Address conversion table value for slave 10 of F
- Page 131B-63494EN/02 6.PARAMETERS 1936 Unit number of the 1st FSSB I/O unit 1937 Unit number of the 2nd FSSB I/O unit CAUTION 1 When these parameters have been set, the power must be turned off before operation is continued. 2 These parameters are shared for the connector numbers of the first and second sep
- Page 1326.PARAMETERS B-63494EN/02 6.4 FUNCTIONS THAT REQUIRE SPECIAL PARAMETER SETTINGS 6.4.1 Tandem Control To use tandem control, set the following parameters. • Master axis No special parameter settings are required. • Slave axis No.1904#6(DCN)=1 No.2078=0 No.2079=0 6.4.2 Simple Electronic Gear Box and E
- Page 133B-63494EN/02 6.PARAMETERS • 2-CPU 3-path control (No axis change can be made between tool post 1 and tool post 2 or 3.) No.1023 Set parameter No.1023 to 9 for the axis of tool post 2. When an FSSB I/O extension unit is used, set parameter No. 1023 to 10 for the axis of tool post 2. No.1945, No.1947,
- Page 1346.PARAMETERS B-63494EN/02 6.4.4 Closed Loop Control When using a separate position detector, make the following parameter settings: (1) With the dual check safety function, the monitor reads feedback information from the built-in pulse coder. So, the following parameters need to be set for a machine
- Page 135B-63494EN/02 6.PARAMETERS 6.4.5 PMC Axis Control (Speed Command) If a speed command (axis control command 10h) is specified in PMC axis control, the machine position is lost. So, the following parameters need to be set so that the machine position is not monitored in dual mode: • Bit 0 (NP2x) of par
- Page 1367.START-UP B-63494EN/02 7 START-UP - 130 -�
- Page 137B-63494EN/02 7.START-UP 7.1 START-UP OPERATION The machine tool builder has to do tests for insulation and protective bonding. Testing must be performed according to Chapter 19.2 and 19.3 of the standard IEC 60204-1 by an appropriately authorized person and recorded. Continuity of the protective bon
- Page 1387.START-UP B-63494EN/02 Safe speed monitoring test This test checks that when the actual speed exceeds a speed limit, safety stop state is set by a stop response. When multiple safety speeds are set, all safety speeds need to be checked. Safe machine position monitoring test A positional limit test
- Page 139B-63494EN/02 7.START-UP 7.2 START-UP OF THE DUAL CHECK SAFETY FUNCTION 7.2.1 Initial Start-up Main flow Disable dual check FSSB I/O setting Safety parameter safety function input Machine start-up Step 1 Initial state First, check that the machine starts up normally when the dual check safety functio
- Page 1407.START-UP B-63494EN/02 Step 3 Safety parameter input Enable the dual check safety function, and enter the safety parameters. Enable the dual check safety Bit 6 of PRM No. 1902 Preparation 1 function. =1 Enables output (MCF), from I/O, Preparation 2 Enable I/O output. that indicates MCC is turned of
- Page 141B-63494EN/02 7.START-UP Step 7 Parameter preservation Save all parameters including the safety parameters. The parameters are used to start up the series. Step 8 Set a password. A password is used to disable unauthorized persons from modifying safety parameters. Before safety parameters of the equip
- Page 1428.MAINTENANCE B-63494EN/02 8 MAINTENANCE - 136 -�
- Page 143B-63494EN/02 8.MAINTENANCE 8.1 SAFETY PRECAUTIONS This section describes the safety precautions related to the use of CNC units. It is essential that these precautions be observed by users to ensure the safe operation of machines equipped with a CNC unit (all descriptions in this section assume this
- Page 1448.MAINTENANCE B-63494EN/02 MAINTENANCE PARTS TO BE MAINTAINED PERIODICALLY • Memory backup battery replacement WARNING When replacing the memory backup batteries, keep the power to the machine (CNC) turned on, and apply an emergency stop to the machine. Because this work is performed with the power
- Page 145B-63494EN/02 8.MAINTENANCE 2. When checking the machine operation with the power magnetics cabinet door opened. (1) The power magnetics cabinet has a high-voltage section (carrying a mark). Never touch the high-voltage section. The high-voltage section presents a severe risk of electric shock. Befor
- Page 1468.MAINTENANCE B-63494EN/02 WARNINGS RELATED TO REPLACEMENT WARNING 1. Always turn off the power to the CNC and the main power to the power magnetics cabinet. If only the power to the CNC is turned off, power may continue to be supplied to the serve section. In such a case, replacing a unit may damag
- Page 147B-63494EN/02 8.MAINTENANCE 8.2 ALARMS AND MESSAGES 8.2.1 Overview Alarms related to the dual check safety function cannot be cancelled by a reset. To cancel the alarms, turn off the power, remove the causes of the alarms, then turn on the power again. For information about emergency stop mode, MCC o
- Page 1488.MAINTENANCE B-63494EN/02 8.2.2 Servo Alarms No. Meaning Description Servo axis operation when alarm is issued 364 n AXIS: SOFT PHASE The servo control software detected an abnormal data Immediate stop ALARM(INT) skip in a velocity feedback signal on axis n (axis 1 to axis (same as 8). emergency st
- Page 149B-63494EN/02 8.MAINTENANCE No. Meaning Description Servo axis operation when alarm is issued 474 n AXIS:EXCESS ERROR The monitor detected that the positional deviation during Immediate stop (STOP:MNT) a stop on axis n (axis 1 to axis 8) exceeded the setting (parameter No. 1829) in safety signal mode
- Page 1508.MAINTENANCE B-63494EN/02 No. Meaning Description Servo axis operation when alarm is issued 480 n AXIS:ILLEGAL SAFETY The monitor detected that safety signal mode D (state in Immediate stop MODE (MNT) which the guard is open although no guard open request is input) was set, or the guard is open whe
- Page 151B-63494EN/02 8.MAINTENANCE No. Meaning Description Servo axis operation when alarm is issued 487 ILLEGAL SAFETY MODE The CNC detected that safety signal mode D (state in Immediate stop (CNC) which the guard is open although no guard open request is input) was set, or the guard is open when guard unl
- Page 1528.MAINTENANCE B-63494EN/02 No. Meaning Description Servo axis operation when alarm is issued 494 n AXIS:SAFTY SPEED The CNC detected that the specified speed on axis n Immediate stop EXCEEDED (CNC) (axis 1 to axis 8) exceeded the setting (parameter No. 1942 / No. 13821 to No. 13824) in safety signal
- Page 153B-63494EN/02 8.MAINTENANCE 8.2.3 Serial Spindle Alarms No. Meaning Description Servo axis operation when alarm is issued 749 S-SPINDLE LSI It is serial communication error while system is executing after power Immediate stop ERROR supply on. Check optical cable connection between main CPU board and
- Page 1548.MAINTENANCE B-63494EN/02 No. Meaning Description Servo axis operation when alarm is issued 786 SPINDLE-4 ILLEGAL Same as alarm No. 756. (For the second spindle) Immediate stop AXIS DATA 787 SPINDLE-4 SAFETY Same as alarm No. 757. (For the second spindle) Immediate stop SPEED OVER 7n16 SPN n :S-SPI
- Page 155B-63494EN/02 8.MAINTENANCE 8.2.4 Alarms Displayed on the Spindle Unit No. Meaning Description 16 RAM Alarm An error occurred in a spindle RAM test. Replace spindle amplifier module. 69 Safety speed over The spindle software detected that the speed of the spindle motor exceeded the safety speed (para
- Page 1568.MAINTENANCE B-63494EN/02 8.2.5 System Alarms No. Meaning Description 900 ROM PARITY Parity error of the CNC, macro, or servo ROM. When the dual check safety function is used: 1 Parity error of the CNC, macro, or servo ROM 2 CRC error of the CNC, servo, or monitor ROM Reinstall the indicated ROM in
- Page 157B-63494EN/02 9.DIAGNOSIS 9 DIAGNOSIS - 151 -�
- Page 1589.DIAGNOSIS B-63494EN/02 9.1 OVERVIEW The information of safety signal mode and safety input signal of the dual check safety function is displayed. For information about emergency stop mode, MCC off Test mode, and safety signal modes A/B/C/D, see Chapter 5. - 152 -�
- Page 159B-63494EN/02 9.DIAGNOSIS 9.2 DIAGNOSIS #7 #6 #5 #4 #3 #2 #1 #0 Diagnosis No. 376 FMC FGL FGD The current states of safety signals input via the FSSB are displayed. FGD The state of the guard state signal (SGD2) is displayed. FGL The state of the guard lock state signal (GDL2) is displayed. FMC The s
- Page 1609.DIAGNOSIS B-63494EN/02 9.3 DUAL CHECK SAFETY DIAGNOSIS SCREEN 9.3.1 Overview The screen dedicated to dual check safety maintenance is displayed in the
screen. This screen displays the current machine state (state of safety-related signals input/output via the two paths (PMC/FSSB)) and the ma - Page 161B-63494EN/02 9.DIAGNOSIS 9.3.3 Screen Display (1) Current machine state display <1> General [Page 1] • The safety signal mode (SAFE MODE) is displayed. The table below indicates safety signal modes and their priorities. Priority Mode High EMERGENCY STOP MCC OFF TEST A) NORMAL MODE B) GUARD OPEN REQ
- Page 1629.DIAGNOSIS B-63494EN/02 <2> DI/DO-related data [Page 2] (Safety DI) • The states of input signals transferred via the PMC and FSSB are displayed. • For a mismatching signal, "#" is prefixed to the address. (However, "#" is not displayed for bit 0 of G332/DI+000 and bits 2 and 3 of G191/DI+001 even
- Page 163B-63494EN/02 9.DIAGNOSIS [Pages 4 and 5] (Safety area) The states of *ESP, *BRK, and DI/DO are displayed. Screen layout - 157 -�
- Page 1649.DIAGNOSIS B-63494EN/02 <3> Machine information (displayed only when bit 0 (DCS) of parameter No. 13801 = 1) [Page 6] (Machine position) • The machine position (detection unit) on the CNC/monitor side is displayed. • A blank is displayed for all axes with dual check safety disabled. • For an axis n
- Page 165B-63494EN/02 9.DIAGNOSIS [Page 8] (Feed axis speed) • The speed (detection unit/interpolation cycle(NOTE)) on the CNC/monitor side is displayed. • A blank is displayed for all axes with dual check safety disabled. • For an axis exceeding the safety speed, the data is suffixed with "#". NOTE When bit
- Page 1669.DIAGNOSIS B-63494EN/02 <4> Monitoring state (displayed only when bit 0 (DCS) of parameter No. 13801 = 1) [Page 10] (Feed axis monitoring) • The monitoring state (cross-check data) on the CNC/monitor side is displayed. • When five or more axes are involved, the screen display is divided into two sc
- Page 167B-63494EN/02 9.DIAGNOSIS (2) Data when an alarm is issued <1> General [Page 1] • For the first detected alarm related to dual check safety, the date and time of alarm issue, alarm number, and message are displayed. • If no alarm is issued yet, "NO ALARM" is displayed, and "0" is displayed for the ot
- Page 1689.DIAGNOSIS B-63494EN/02 <2> DI/DO-related data [Page 2] • The states of input signals transferred via the PMC and FSSB are displayed when a dual check safety alarm is issued. If no alarm is issued yet, "0" is displayed for all data items. • For a mismatching signal, "#" is prefixed to the address.
- Page 169B-63494EN/02 9.DIAGNOSIS [Page 6] (Feed axis speed) • The speeds (detection unit/interpolation period) on the CNC and monitor sides are displayed when a dual check safety alarm is issued. If no alarm is issued yet, "0" is displayed for all data items. • A blank is displayed for all axes with dual ch
- Page 1709.DIAGNOSIS B-63494EN/02 [Page 9] (Spindle monitoring) • The monitoring states (cross-check data) on the CNC and spindle sides are displayed when a dual check safety alarm is issued. If no alarm is issued yet, "0" is displayed for all data items. • If a mismatch is detected between the monitoring st
- Page 171B-63494EN/02 10.SAMPLE SYSTEM CONFIGURATION 10 SAMPLE SYSTEM CONFIGURATION - 165 -�
- Page 17210.SAMPLE SYSTEM CONFIGURATION B-63494EN/02 10.1 SAMPLE CONFIGURATION 10.1.1 For 1-path (When One PSM Is Used) - 166 -�
- Page 173B-63494EN/02 10.SAMPLE SYSTEM CONFIGURATION 10.1.2 For 1-path (When One PSM Is Used) - 167 -�
- Page 17410.SAMPLE SYSTEM CONFIGURATION B-63494EN/02 10.1.3 For 2-path (When the main side and sub side use a common MCC) - 168 -�
- Page 175B-63494EN/02 10.SAMPLE SYSTEM CONFIGURATION 10.1.4 For 2-path (When the main side and sub side use independent MCCs and protection doors) - 169 -�
- Page 17610.SAMPLE SYSTEM CONFIGURATION B-63494EN/02 10.2 SAMPLE CONNECTIONS 10.2.1 Emergency Stop Signal (*ESP1, *ESP2) +24V I/O-Link I/O UNIT *ESP1 (X008#4) FSSB I/O UNIT *ESP2 (DI+000#0) 0V PSM CX4 ESP NOTES Use a two-contact emergency stop button with a forced dissociation mechanism. Connect the emergenc
- Page 177B-63494EN/02 10.SAMPLE SYSTEM CONFIGURATION 10.2.2 Guard Open Request Signal (ORQ) NOTES Create a Ladder program of conditions for making a guard open request and then input the program to the PMC side [G191#3]. When the guard open request signal (ORQ) is input and when CNC safety has been confirmed
- Page 17810.SAMPLE SYSTEM CONFIGURATION B-63494EN/02 10.2.4 Guard Unlock Signal (*LGD), Guard Lock State Signal (GDL), Guard State Signal (SGD) When one protective door is used The following figure shows the example which combined the safety guard switch with safety relay. +24V Guard closed SW1 SW2 Guard-mon
- Page 179B-63494EN/02 10.SAMPLE SYSTEM CONFIGURATION When one protective door is used The following figure shows the example which combined the safety guard switch without safety relay. +24V Guard closed SW1 SW2 Guard-monitoring limit switch SW3 SW4 0V [Sample control components] I/O Link I/O UNIT PMC SW1/SW
- Page 18010.SAMPLE SYSTEM CONFIGURATION B-63494EN/02 When one protection area has two protective doors When one protection area has two protective doors, for example, a limit switch for guard monitoring with a lock can be installed on each protective door together with a safety relay as shown below. +24V Gua
- Page 181B-63494EN/02 10.SAMPLE SYSTEM CONFIGURATION Operating principle - When one protective door is used The table below indicates the states of each component. States of each component Guard Guard lock SW1 SW2 SW3 RY1 RY2 RY3 SGD 1 CLOSE LOCKED CLOSE CLOSE CLOSE ON ON OFF 1 2 CLOSE UNLOCKED CLOSE CLOSE O
- Page 18210.SAMPLE SYSTEM CONFIGURATION B-63494EN/02 The guard state is monitored, and the guard state signal (SGD) affects the dual check safety function. The guard lock state signal (GDL) only indicates whether an input mismatch is found. The state of the GDL signal does not affect the dual check safety fu
- Page 183B-63494EN/02 10.SAMPLE SYSTEM CONFIGURATION 10.2.5 MCC On Enable Signal (MCF), MCC Contact State Signal (*SMC) +24V I/O Link I/O UNIT PMC *SMC1 X00n#n (G191#6) MCF1 Y00n#n (F191#1) 0V FSSB I/O UNIT *SMC2 (DI+001#6) MCF (DO+000#1) 0V PSM 200A 200B CX3 MCC U V W Electromagnetic contactor (MAIN MCC) No
- Page 18411.APPLYCATION OF OTHER FUNCTIONS B-63494EN/02 11 APPLYCATION OF OTHER FUNCTIONS - 178 -�
- Page 185B-63494EN/02 11.APPLYCATION OF OTHER FUNCTIONS 11.1 OVERVIEW The dual check safety function becomes easier to use when combined with various other functions. This section describes the functions. Part of the section assumes the use of the dual check safety function. Therefore, if the function is not
- Page 18611.APPLYCATION OF OTHER FUNCTIONS B-63494EN/02 11.2 EXTERNAL DECELERATION 11.2.1 Overview The dual check safety function uses the CNC CPU and monitor DSP to separately monitor the specified speed of the feed axis (safe speed monitoring function). When one or more axes have a speed greater than or eq
- Page 187B-63494EN/02 11.APPLYCATION OF OTHER FUNCTIONS 11.2.2 Specifications External deceleration speed The external deceleration speed is set for each of rapid traverse and cutting feed. Three sets of external deceleration speeds and external deceleration signals are provided as external deceleration sett
- Page 18811.APPLYCATION OF OTHER FUNCTIONS B-63494EN/02 In manual handle feed, the relationships between external deceleration settings, external signals, and parameters are shown in the table below. Signal Parameter Settings External Manual handle feed External deceleration maximum speed Valid/Invalid decel
- Page 189B-63494EN/02 11.APPLYCATION OF OTHER FUNCTIONS 11.2.3 Signals 11.2.3.1 Details on signals Manual handle feed maximum feedrate change signal HNDLF
- Page 19011.APPLYCATION OF OTHER FUNCTIONS B-63494EN/02 11.2.3.2 Signal address #7 #6 #5 #4 #3 #2 #1 #0 G023 HNDLF #7 #6 #5 #4 #3 #2 #1 #0 G101 *+ED28 *+ED27 *+ED26 *+ED25 *+ED24 *+ED23 *+ED22 *+ED21 G103 *-ED28 *-ED27 *-ED26 *-ED25 *-ED24 *-ED23 *-ED22 *-ED21 #7 #6 #5 #4 #3 #2 #1 #0 G107 *+ED38 *+ED37 *+ED3
- Page 191B-63494EN/02 11.APPLYCATION OF OTHER FUNCTIONS 1426 External deceleration rate setting 1 in cutting feed 1440 External deceleration rate setting 2 in cutting feed 1443 External deceleration rate setting 3 in cutting feed [Data type] Word [Unit of data] [Valid data range] Increment Valid data range U
- Page 19211.APPLYCATION OF OTHER FUNCTIONS B-63494EN/02 11.3 SPINDLE OUTPUT CONTROL BY THE PMC 11.3.1 Overview The dual check safety function uses the CNC CPU and spindle DSP to separately monitor the spindle speed (safe speed monitoring function). When one or more spindles have a speed greater than or equal
- Page 193B-63494EN/02 11.APPLYCATION OF OTHER FUNCTIONS 11.3.2 Specifications Switching control Spindle output control function by the PMC can be used to specify the following: • Spindle motor speed (number of rotations) • Output polarity for each spindle motor (direction of rotation) Usually, the CNC is use
- Page 19411.APPLYCATION OF OTHER FUNCTIONS B-63494EN/02 11.3.3 Signals 11.3.3.1 Details on signals Signals used to select the spindle motor speed command SIND
- Page 195B-63494EN/02 11.APPLYCATION OF OTHER FUNCTIONS 11.3.3.2 Signal address #7 #6 #5 #4 #3 #2 #1 #0 G032 R08I R07I R06I R05I R04I R03I R02I R01I G033 SIND SSIN SGN R12I R11I R10I R09I #7 #6 #5 #4 #3 #2 #1 #0 G034 R08I2 R07I2 R06I2 R05I2 R04I2 R03I2 R02I2 R01I2 G035 SIND2 SSIN2 SGN2 R12I2 R11I2 R10I2 R09I
- Page 19611.APPLYCATION OF OTHER FUNCTIONS B-63494EN/02 11.4 SPINDLE POSITIONING (T SERIES) 11.4.1 Overview The dual check safety function uses the CNC CPU and spindle DSP to separately monitor the actual speed of the spindle (safe speed monitoring function). When the stop status of the spindle is monitored
- Page 197B-63494EN/02 11.APPLYCATION OF OTHER FUNCTIONS 11.4.2 Specifications Spindle positioning Spindle positioning is performed as follows. • Cancel the spindle rotation mode, which is used for turning with the spindle rotating, and enter the spindle positioning mode. • Position the spindle in the spindle
- Page 19811.APPLYCATION OF OTHER FUNCTIONS B-63494EN/02 Semi-fixed angle positioning Semi-fixed angle positioning is specified by a two-digit value that follows address M. The six values from Mx to M(x+5) can be specified. (For extended specifications, 256 values from MX to M(X+255) can be specified.) The va
- Page 199B-63494EN/02 11.APPLYCATION OF OTHER FUNCTIONS 11.4.3 Signals 11.4.3.1 Details on signals Spindle stop complete signal SPSTP
- Page 20011.APPLYCATION OF OTHER FUNCTIONS B-63494EN/02 11.4.3.2 Signal address #7 #6 #5 #4 #3 #2 #1 #0 G028 SPSTP *SCPF *SUCPF #7 #6 #5 #4 #3 #2 #1 #0 F038 SUCLP SCLP F094 ZP8 ZP7 ZP6 ZP5 ZP4 ZP3 ZP2 ZP1 11.4.4 Parameters 1020 Program axis name for each axis [Data type] Byte axis Set a value of 67 (C-axis)
- Page 201B-63494EN/02 11.APPLYCATION OF OTHER FUNCTIONS #7 #6 #5 #4 #3 #2 #1 #0 4000 RETSV [Data type] Bit RETSV Reference position return direction of spindle. 0: CCW (Counter clockwise) 1: CW (Clockwise) 4044 Proportional gain of the velocity loop in servo mode (HIGH gear) 4045 Proportional gain of the vel
- Page 20211.APPLYCATION OF OTHER FUNCTIONS B-63494EN/02 4073 Grid shift amount on servo mode [Data type] Word [Unit of data] 1 pulse (=360deg/4096) [Valid data range] 0 to 4095 The reference position is shifted counterclockwise by the set number of pulses. #7 #6 #5 #4 #3 #2 #1 #0 4950 IMB ESI TRV ISZ IDM IOR
- Page 203B-63494EN/02 11.APPLYCATION OF OTHER FUNCTIONS 2) Specify an operation with the M code (parameter No. 4962) for specifying the spindle positioning angle. 3) Specify an operation with the M code (parameter No. 4961) for releasing spindle positioning. For the B specification, when the M code (paramete
- Page 20411.APPLYCATION OF OTHER FUNCTIONS B-63494EN/02 CAUTION Set this parameter even when the semi-fixed angle spindle positioning command is not executed. Otherwise, the M codes from M00 to M05 do not function normally. 4963 Basic rotation angle of spindle positioning [Data type] Word [Unit of data] deg
- Page 205B-63494EN/02 11.APPLYCATION OF OTHER FUNCTIONS 11.5 Cs CONTOUR CONTROL 11.5.1 Overview The dual check safety function uses the CNC CPU and spindle DSP to separately monitor the actual speed of the spindle (safe speed monitoring function). When the stop status of the spindle is monitored by the safe
- Page 20611.APPLYCATION OF OTHER FUNCTIONS B-63494EN/02 11.5.2 Specifications Cs contour control mode The Cs contour control change signal is used to switch between spindle rotation control (method of controlling the rotation of the spindle with the velocity command) and spindle contour control (method of co
- Page 207B-63494EN/02 11.APPLYCATION OF OTHER FUNCTIONS 11.5.3 Signals 11.5.3.1 Details on signals Cs contour control change signal CON
- Page 20811.APPLYCATION OF OTHER FUNCTIONS B-63494EN/02 Cs contour control change signals in each axis CONS1 to CONS4
- Page 209B-63494EN/02 11.APPLYCATION OF OTHER FUNCTIONS 11.5.4 Parameters #7 #6 #5 #4 #3 #2 #1 #0 1006 ROTx [Data type] Bit axis ROTx Controlled axis is: 0: Linear axis. 1: Rotation axis. Set 1 for the Cs contour control axis. 1022 Setting of each axis in the basic coordinate system [Data type] Byte axis Spe
- Page 21011.APPLYCATION OF OTHER FUNCTIONS B-63494EN/02 4056 Gear ratio (HIGH gear) 4057 Gear ratio (MEDIUM HIGH gear) 4058 Gear ratio (MEDIUM LOW gear) 4059 Gear ratio (LOW gear) [Data type] Word [Unit of data] Motor speed per spindle rotation × 100 [Valid data range] 0 to 32767 These parameters set the gea
- Page 211B-63494EN/02 11.APPLYCATION OF OTHER FUNCTIONS 11.6 SPINDLE ORIENTATION 11.6.1 Overview The dual check safety function uses the CNC CPU and spindle DSP to separately monitor the actual speed of the spindle (safe speed monitoring function). When the stop status of the spindle is monitored by the safe
- Page 21211.APPLYCATION OF OTHER FUNCTIONS B-63494EN/02 11.6.3 Signals 11.6.3.1 Details on signals Orientation command signal ORCMA
- Page 213B-63494EN/02 11.APPLYCATION OF OTHER FUNCTIONS Orientation completion signal ORARA
- Page 21411.APPLYCATION OF OTHER FUNCTIONS B-63494EN/02 4031 Position coder method orientation stop position [Data type] Word [Unit of data] 1 pulse unit (360°/4096) [Valid data range] 0 to 4096 Set the position coder method orientation stop position. 4038 Spindle orientation speed [Data type] Word [Unit of
- Page 215B-63494EN/02 11.APPLYCATION OF OTHER FUNCTIONS 4060 Position gain on orientation (HIGH gear) 4061 Position gain on orientation (MEDIUM HIGH gear) 4062 Position gain on orientation (MEDIUM LOW gear) 4063 Position gain on orientation (LOW gear) [Data type] Word [Unit of data] 0.01 sec-1 [Valid data ra
- Page 21611.APPLYCATION OF OTHER FUNCTIONS B-63494EN/02 11.6.5 Sequence The following is a sample sequence in which orientation is specified during rotation of the spindle and work is conducted with the spindle stopped. M otor speed ORCMA Speed com m and SFRA (S RVA ) ORARA S afe speed Level sw itching O pen
- Page 217B-63494EN/02 12.COMPONENTS LIST 12 COMPONENTS LIST - 211 -�
- Page 21812.COMPONENTS LIST B-63494EN/02 12.1 HARDWARE COMPONENTS 12.1.1 Hardware Components for Series 16i/18i/21i/160i/180i/210i/160is/180is/210is-MODEL A Specification number Specification number No. Description Remarks Of primary component of secondary component 1 Main board A20B-8100-0130 A20B-8100-013X
- Page 219B-63494EN/02 12.COMPONENTS LIST 12.1.3 Hardware Components for Other Units Specification number Specification number No. Description Remarks Of primary component of secondary component 1 FSSB ADDITIONAL A20B-2100-0270 DETECTOR INTERFACE 2 I/O module A20B-2100-0150 A20B-2002-0400 A20B-2100-0410 A20B-
- Page 22012.COMPONENTS LIST B-63494EN/02 12.2 SOFTWARE COMPONENTS [CNC software] Series / Version Functions Series 16i-TB CNC functions for lathe with up to 8 servo Series 160i-TB B1H1 axes and up to 2 spindle axes. Series 160is-TB Series 18i-TB CNC functions for lathe with up to 6 servo Series 180i-TB BEH1
- Page 221B-63494EN/02 12.COMPONENTS LIST 12.3 SERVO AMPLIFIER No. Description Module Name Specification number Remarks 1 Power Supply Module PSM-5.5 A06B-6077-H106 (Standard, 200V input) PSM-11 A06B-6077-H111 PSM-15 A06B-6087-H115 PSM-26 A06B-6087-H126 PSM-30 A06B-6087-H130 PSM-37 A06B-6087-H137 PSM-45 A06B-
- Page 22212.COMPONENTS LIST B-63494EN/02 No. Description Module Name Specification number Remarks 5 Servo Amplifier Module SVM1-180HVi A06B-6124-H106 (1 axis type, 400V input) SVM1-360HVi A06B-6124-H109 6 Servo Amplifier Module SVM1-4i A06B-6130-H001 (βi series, 200V input) SVM1-20i A06B-6130-H002 SVM1-40i A
- Page 223B-63494EN/02 12.COMPONENTS LIST No. Description Module Name Specification number Remarks 12 Spindle Amplifier Module SPM-11-4 A06B-6102-H111#H520 (SPM HRV Type IV, 200V input) SPM-15-4 A06B-6102-H115#H520 SPM-22-4 A06B-6102-H122#H520 SPM-26-4 A06B-6102-H126#H520 SPM-30-4 A06B-6102-H130#H520 SPM-45-4
- Page 224B-63494EN/02 INDEX INDEX Directives ..........................................................................2
DUAL CHECK SAFETY DIAGNOSIS SCREEN .......154 1-CPU 2-Path Control ..................................................... 99 1-CPU 2-path Control (Series 16i/18i-TB) .............. - Page 225INDEX B-63494EN/02 Initial Start-up ............................................................... 133 SAMPLE CONNECTIONS ..........................................170 INSTALLATION............................................................ 45 SAMPLE SYSTEM CONFIGURATION .....................165 Sc
- Page 226Revision Record FANUC Series 16i/160i/160is/18i/180i/180is/21i/210i/210is-MODEL B Dual Check Safety OPERATOR’S MANUAL (B-63494EN) Addition of following items • Programmable safe-related i/o signals • Safety position switch signal • Overall connection diagram (loader control) 02 Nov., 2004 • Function