Series 15i/150i-MB Operators manual Page 551
Operators manual
B-63784EN-1/01 OPERATION 10.DISPLAY
- 529 -
At the left end of the horizontal axis, the time at the graph origin that
has elapsed since the start of store operation is indicated, and the scale
on the horizontal axis indicates the time from the graph origin.
The values of the origins of the vertical axis and horizontal axis, and
the unit of the scale can be changed by soft keys.
Torque data may be displayed in two modes: all-axes display mode and
single-axis display mode. You can switch between these modes by
using a soft key.
In all-axes display mode, torque data for all target axes is graphed; in
single-axis display mode, torque data for a specified target axis is
graphed.
When the sample data preservation function is enabled in all-axes
display mode, the data to be displayed can be selected from the latest
data and sample data by using a soft key. In single-axis display mode,
both the latest data and sample data are displayed at the same time.
- Displayed information
On the right side of the screen, some pieces of information is displayed.
The following explains the information displayed in each of all-axes
display mode and single-axis display mode.
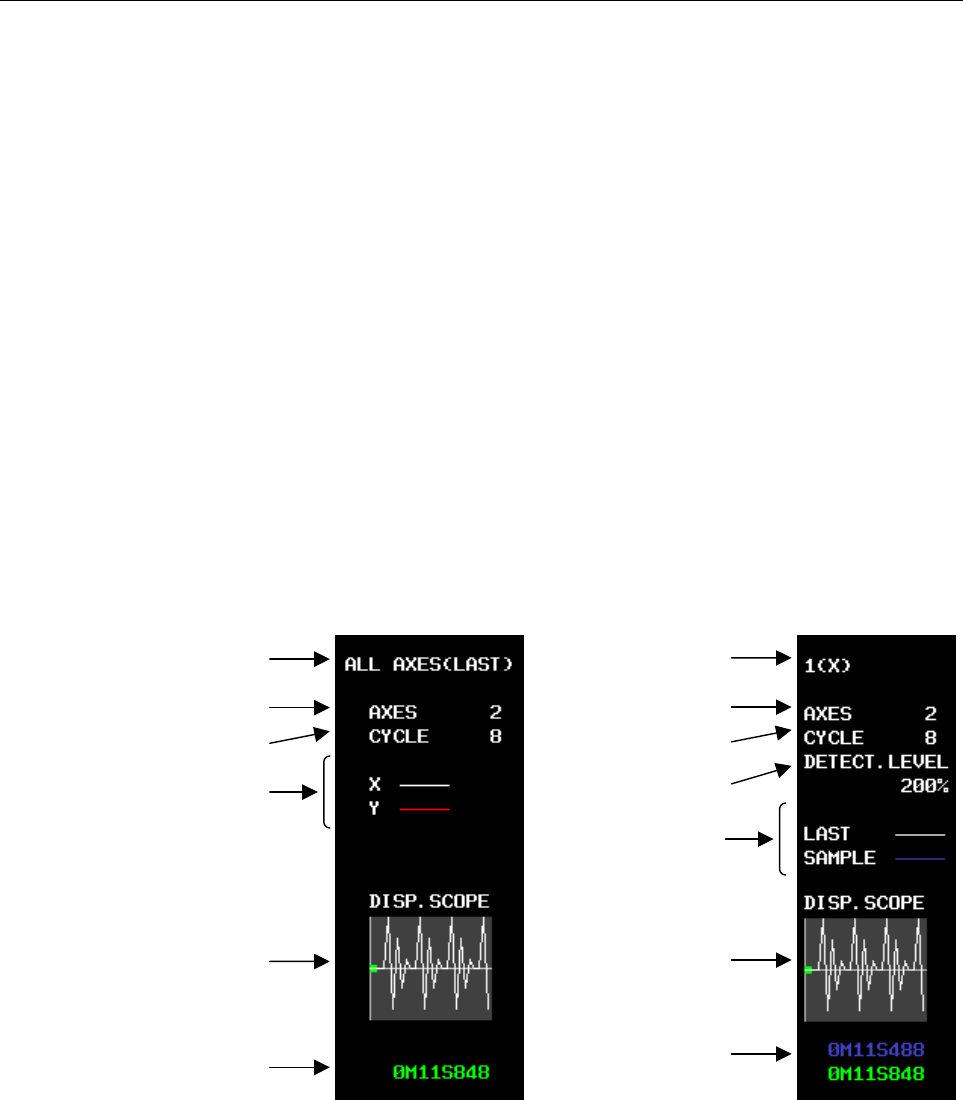
Fig. 10.18.(b) All Axes Fig. 10.18.(c) Single Axis
(A) Data type
In all-axes display mode, ALL AXES is indicated, followed by the
indication of the latest data or sample data.
In single-axis display mode, a target axis number and axis name
are indicated.
(E)Drawing color
(A) Data type
(B) Number o
f
valid axes
(C) Store cycle
(F) Display range
(G) Total store time
(D) Detection level
(A) Data type
(
B
)
Number of valid axes
(C) Store cycle
(
E
)
Drawin
g
color
(F) Display range
(G) Total store time
Contents Summary of Series 15i/150i-MB Operators manual
- Page 1OPERRATOR’S MANUAL (OPERATION) B-63784EN-1/01
- Page 2• No part of this manual may be reproduced in any form. • All specifications and designs are subject to change without notice. The export of this product is subject to the authorization of the government of the country from where the product is exported. In this manual we have tried as much as possi
- Page 3B-63784EN-1/01 SAFETY PRECAUTIONS SAFETY PRECAUTIONS This section describes the safety precautions related to the use of CNC units. It is essential that these precautions be observed by users to ensure the safe operation of machines equipped with a CNC unit (all descriptions in this section assume t
- Page 4SAFETY PRECAUTIONS B-63784EN-1/01 DEFINITION OF WARNING, CAUTION, AND NOTE This manual includes safety precautions for protecting the user and preventing damage to the machine. Precautions are classified into Warning and Caution according to their bearing on safety. Also, supplementary information i
- Page 5B-63784EN-1/01 SAFETY PRECAUTIONS GENERAL WARNINGS AND CAUTIONS WARNING 1. Never attempt to machine a workpiece without first checking the operation of the machine. Before starting a production run, ensure that the machine is operating correctly by performing a trial run using, for example, the sing
- Page 6SAFETY PRECAUTIONS B-63784EN-1/01 WARNING 8. Some functions may have been implemented at the request of the machine-tool builder. When using such functions, refer to the manual supplied by the machine-tool builder for details of their use and any related cautions. NOTE Programs, parameters, and macr
- Page 7B-63784EN-1/01 SAFETY PRECAUTIONS WARNINGS AND CAUTIONS RELATED TO PROGRAMMING This section covers the major safety precautions related to programming. Before attempting to perform programming, read the supplied operator's manual and programming manual carefully such that you are fully familiar with
- Page 8SAFETY PRECAUTIONS B-63784EN-1/01 WARNING 6.Stroke check After switching on the power, perform a manual reference position return as required. Stroke check is not possible before manual reference position return is performed. Note that when stroke check is disabled, an alarm is not issued even if a
- Page 9B-63784EN-1/01 SAFETY PRECAUTIONS WARNINGS AND CAUTIONS RELATED TO HANDLING This section presents safety precautions related to the handling of machine tools. Before attempting to operate your machine, read the supplied operator's manual and programming manual carefully, such that you are fully fami
- Page 10SAFETY PRECAUTIONS B-63784EN-1/01 WARNING 6.Origin/preset operation Basically, never attempt an origin/preset operation when the machine is operating under the control of a program. Otherwise, the machine may behave unexpectedly, possibly damaging the tool, the machine itself, the tool, or causing i
- Page 11B-63784EN-1/01 SAFETY PRECAUTIONS WARNING 12.Cutter and tool nose radius compensation in MDI mode Pay careful attention to a tool path specified by a command in MDI mode, because cutter or tool nose radius compensation is not applied. When a command is entered from the MDI to interrupt in automatic
- Page 12SAFETY PRECAUTIONS B-63784EN-1/01 WARNINGS RELATED TO DAILY MAINTENANCE WARNING 1.Memory backup battery replacement When replacing the memory backup batteries, keep the power to the machine (CNC) turned on, and apply an emergency stop to the machine. Because this work is performed with the power on
- Page 13B-63784EN-1/01 SAFETY PRECAUTIONS WARNING 2.Absolute pulse coder battery replacement When replacing the memory backup batteries, keep the power to the machine (CNC) turned on, and apply an emergency stop to the machine. Because this work is performed with the power on and the cabinet open, only thos
- Page 14SAFETY PRECAUTIONS B-63784EN-1/01 WARNING 3.Fuse replacement For some units, the chapter covering daily maintenance in the operator's manual or programming manual describes the fuse replacement procedure. Before replacing a blown fuse, however, it is necessary to locate and remove the cause of the b
- Page 15B-63784EN-1/01 TABLE OF CONTENTS TABLE OF CONTENTS SAFETY PRECAUTIONS .......................................................................... s-1 I GENERAL 1 GENERAL ..............................................................................................3 1.1 GENERAL FLOW OF OPERATION OF CN
- Page 16TABLE OF CONTENTS B-63784EN-1/01 2.5 FUNCTION KEYS AND SOFT KEYS ..........................................................44 2.5.1 General Screen Operations .................................................................................... 44 2.5.2 Function Keys...................................
- Page 17B-63784EN-1/01 TABLE OF CONTENTS 3.10 CHANGING TOOL LENGTH COMPENSATION IN THE LONGITUDINAL DIRECTION OF THE TOOL ..............................101 3.11 TOOL HOLDER OFFSET ..........................................................................102 3.12 ROTARY AXIS ORIGIN COMPENSATION AND ROTARY AX
- Page 18TABLE OF CONTENTS B-63784EN-1/01 6 SAFETY FUNCTIONS........................................................................188 6.1 EMERGENCY STOP .................................................................................189 6.2 OVERTRAVEL.......................................................
- Page 19B-63784EN-1/01 TABLE OF CONTENTS 8.8.2 Copying, Moving, and Deleting Words and Blocks............................................ 275 8.9 CANCELING THE EFFECTS OF EDITING WORDS AND BLOCKS ........276 8.10 COPYING PROGRAMS ............................................................................27
- Page 20TABLE OF CONTENTS B-63784EN-1/01 9.21 MODEM CARD SETTING SCREEN..........................................................410 9.22 CHANGING ACTIVE OFFSET VALUE WITH MANUAL MOVE ................413 9.23 DO SIGNAL OUTPUT BY SOFT KEY .......................................................418 9.24 AUTOMA
- Page 21B-63784EN-1/01 TABLE OF CONTENTS 10.20 αi SERVO AND SPINDLE INFORMATION SCREENS .............................540 11 CLEARING THE SCREEN .................................................................541 11.1 CLEARING THE SCREEN ......................................................................
- Page 22TABLE OF CONTENTS B-63784EN-1/01 12.10.2 Inputting Fixture Offset Data .............................................................................. 581 12.11 INPUTTING AND OUTPUTTING ROTARY HEAD DYNAMIC TOOL OFFSET DATA ..............................................................................
- Page 23I GENERA
- Page 24
- Page 25B-63784EN-1/01 GENERAL 1.GENERAL 1 GENERAL Operator’s Manuals consist of the PROGRAMMING Manual and OPERATION Manual. About this Operator’s Manual OPERATOR’S MANUAL (PROGRAMMING) (B-63784EN) I. GENERAL Describes chapter organization, applicable models, related manuals, and notes for reading this man
- Page 261.GENERAL GENERAL B-63784EN-1/01 Special symbols This manual uses the following symbols: P_ : Indicates a combination of axes such as X_ Y_ Z (used in PROGRAMMING.). ; : Indicates the end of a block. It actually corresponds to the ISO code LF or EIA code CR. Related manuals The table below lists man
- Page 27B-63784EN-1/01 GENERAL 1.GENERAL 1.1 GENERAL FLOW OF OPERATION OF CNC MACHINE TOOL When machining the part using the CNC machine tool, first prepare the program, then operate the CNC machine by using the program. (1) First, prepare the program from a part drawing to operate the CNC machine tool. How
- Page 281.GENERAL GENERAL B-63784EN-1/01 Tool Side cutting Face cutting Hole machining Prepare the program of the tool path and machining condition according to the workpiece figure, for each machining. -6-
- Page 29B-63784EN-1/01 GENERAL 1.GENERAL 1.2 NOTES ON READING THIS MANUAL NOTE 1 The function of an CNC machine tool system depends not only on the CNC, but on the combination of the machine tool, its magnetic cabinet, the servo system, the CNC, the operator's panels, etc. It is too difficult to describe th
- Page 30
- Page 31II OPERATIO
- Page 32
- Page 33B-63784EN-1/01 OPERATION 1.GENERAL 1 GENERAL - 11 -
- Page 341.GENERAL OPERATION B-63784EN-1/01 1.1 MANUAL OPERATION Explanations - Manual reference position return The CNC machine tool has a position used to determine the machine position. This position is called the reference position, where the tool is replaced or the coordinate are set. Ordinarily, after
- Page 35B-63784EN-1/01 OPERATION 1.GENERAL - The tool movement by manual operation Using machine operator's panel switches, pushbuttons, or the manual handle, the tool can be moved along each axis. Machine operator's panel Manual pulse generator Tool Workpiece Fig.1.1 (b) The tool movement by manual operati
- Page 361.GENERAL OPERATION B-63784EN-1/01 1.2 TOOL MOVEMENT BY PROGRAMING – AUTOMATIC OPERATION Automatic operation is to operate the machine according to the created program. It includes memory, MDI and DNC operations. (See Section II-4). Program O1000 ; M_ S_ T_ ; G92 X_ ; Tool G00 ; G01 ; : : Fig. 1.2 (
- Page 37B-63784EN-1/01 OPERATION 1.GENERAL - MDI operation After the program is entered, as an command group, from the MDI keyboard, the machine can be run according to the program. This operation is called MDI operation. CNC MDI keyboard Machine Program entry by manual Fig.1.2 (c) MDI operation - DNC opera
- Page 381.GENERAL OERATION B-63784EN-1/01 1.3 AUTOMATIC OPERATION Explanations - Program selection Select the program used for the workpiece. Ordinarily, one program is prepared for one workpiece. If two or more programs are in memory, select the program to be used, by searching the program number (Section
- Page 39B-63784EN-1/01 OERATION 1.GENERAL - Restart You can continue machining of paused workpieces. If, for example, the tool breaks during machining, you can replace the tool, and then restart machining. (Refer to II-4.7.) Paused Tool Tool drilling Tool breakage Workpiece Workpiece When machining of a pau
- Page 401.GENERAL OERATION B-63784EN-1/01 1.4 TESTING A PROGRAM Before machining is started, the automatic running check can be executed. It checks whether the created program can operate the machine as desired. This check can be accomplished by running the machine actually or viewing the position display c
- Page 41B-63784EN-1/01 OERATION 1.GENERAL 1.4.1 Check by Running the Machine Explanations - Dry run Remove the workpiece, check only movement of the tool. Select the tool movement rate using the dial on the operator's panel. (See Section II-5.2) Tool Table Fig.1.4 (a) Dry run - Feedrate override Check the p
- Page 421.GENERAL OERATION B-63784EN-1/01 - Single block Each time the cycle start button is pressed, one block of a program is executed, then the tool stops. A program is checked by executing it on a block-by-block basis. (See Section II-5.3.) Cycle start Cycle start Cycle start Tool Cycle start Stop Stop
- Page 43B-63784EN-1/01 OERATION 1.GENERAL 1.4.2 How to View the Position Display Change without Running the Machine Explanations - Machine lock The machine tool does not move, and only the position coordinates are updated. MDI X Tool Y Z Workpiece The tool remains stopped, and only the positional displays o
- Page 441.GENERAL OERATION B-63784EN-1/01 1.5 EDITING A PART PROGRAM After a created program is once registered in memory, it can be corrected or modified from the MDI panel (See Section II-8). This operation can be executed using the part program storage/edit function. Program registration Program correcti
- Page 45B-63784EN-1/01 OERATION 1.GENERAL 1.6 DISPLAYING AND SETTING DATA The operator can display or change a value stored in CNC internal memory by key operation on the MDI screen (See II-9). Data setting Data display Screen Keys MDI CNC memory Fig.1.6 (a) Displaying and Setting Data Explanations - Offset
- Page 461.GENERAL OERATION B-63784EN-1/01 1st tool path Machined shape 2nd tool path Offset value of the 1st tool Offset value of the 2nd tool Fig.1.6 (c) Offset Value - Displaying and setting operator's setting data Apart from parameters, there is data that is set by the operator in operation. This data ca
- Page 47B-63784EN-1/01 OERATION 1.GENERAL - Displaying and setting parameters The CNC functions have versatility in order to take action in characteristics of various machines. For example, CNC can specify the following: - Rapid traverse rate of each axis - Whether increment system is based on metric system
- Page 481.GENERAL OERATION B-63784EN-1/01 - Data protection key A key called the data protection key can be defined. It is used to prevent part programs, offset values, parameters, and setting data from being registered, modified, or deleted erroneously. Refer to the relevant manual published by the machine
- Page 49B-63784EN-1/01 OERATION 1.GENERAL 1.7 DISPLAY 1.7.1 Program Display The contents of the currently active program are displayed. In addition, the programs scheduled next and the program list are displayed.(See Section II-10.1) Active sequence number Active program number Program CONTEN Fig.1.7 (a) Cu
- Page 501.GENERAL OERATION B-63784EN-1/01 Fig.1.7 (b) Program list - 28 -
- Page 51B-63784EN-1/01 OERATION 1.GENERAL 1.7.2 Current Position Display The current position of the tool is displayed with the coordinate values. The distance from the current position to the target position can also be displayed. (See Section II-10.5) Y X Y X Workpiece coordinate system - 29 -
- Page 521.GENERAL OERATION B-63784EN-1/01 1.7.3 Operator Message Display Messages stored to memory are displayed when the operator must be instructed during machining. (Refer to II-10.6) "Load the workpiece." Memory Message 1 Message display CRT display number Message 2 Message 3 1.7.4 Alarm Display When a
- Page 53B-63784EN-1/01 OERATION 1.GENERAL 1.7.5 Parts Count Display, Run Time Display When this option is selected, five types of run time and number of parts are displayed on the screen. (See Section II-10.10) - 31 -
- Page 541.GENERAL OERATION B-63784EN-1/01 1.7.6 Graphic Display Programmed tool movement can be displayed on the following planes: (See Section II-10.8) 1) XY plane 2) YZ plane 3) XZ plane 4) Three dimensional display (1) Y (2) Z X Y Display on the XY plane Display on the YZ plane (3) (4) Z Z X X Y Display
- Page 55B-63784EN-1/01 OERATION 1.GENERAL 1.8 DATA INPUT/OUTPUT Programs, offset values, parameters, etc. input in CNC memory can be output to paper tape, cassette, or a floppy disk for saving. After once output to a medium, the data can be input into CNC memory. (See II- 12.) FANUC Floppy FANUC Floppy Cass
- Page 562.OPERATIONAL DEVICES OPERATION B-63784EN-1/01 2 OPERATIONAL DEVICES The available operational devices include the setting and display unit attached to the CNC, the machine operator's panel, and external input/output devices such as a PPR, Handy File, Floppy Cassette, and FA Card. - 34 -
- Page 57B-63784EN-1/01 OPERATION 2.OPERATIONAL DEVICES 2.1 SETTING AND DISPLAY UNITS The setting and display units are shown in Subsections II-2.1.1 to II- 2.1.3. 9.5"/10.4" LCD unit ................................................................II-2.1.1 MDI unit............................................
- Page 582.OPERATIONAL DEVICES OPERATION B-63784EN-1/01 2.1.1 9.5"/10.4" LCD Unit LCD units are following three kinds. - 9.5-inch monochrome (with graphic display) - 9.5-inch monochrome (without graphic display) - 10.4-inch monochrome (with graphic display) NOTE The LCD brightness of the 9.5-inch monochrome
- Page 59B-63784EN-1/01 OPERATION 2.OPERATIONAL DEVICES 2.1.2 MDI Unit Address/numeric keys Help key ResetT key RESET O( N) GE P C 7 8 9 ALTER X U Y V Z W Q? 4 5 6 INSERT Edit key HELP I , J A K@ R 1 2 3 DELETE Cancel (CAN) key M# S T L - 0 . = * SHIFT F [ D ] H & B SP / EOB CAN INPUT Input key OFFSET PAGE P
- Page 602.OPERATIONAL DEVICES OPERATION B-63784EN-1/01 2.1.3 MDI Unit (Full-keyboard) Rest kry RESET A B C/ D# E F G H& ! " $ % * I J , K : L ; MSP N O? P< Q > R S ¥ T U - V [ W] X ( Y ) Z@ Address/numeric keys 7 8 9 SHIFT ALTER CALC POS PROG OFFSET SETTING CUSTOM Function keys Shift key 4 5 6 HELP INSERT S
- Page 61B-63784EN-1/01 OPERATION 2.OPERATIONAL DEVICES 2.1.4 MDI Unit (Main Panel A/B) for Machine Operator's Panel The following MDI unit for machine operator's panel can be used. Reset key Address/numeric keys Function keys Help key Shift key Page change key Edit keys Input key Cursor keys Cancel key - 39
- Page 622.OPERATIONAL DEVICES OPERATION B-63784EN-1/01 2.2 EXPLANATION OF THE KEYBOARD Table2.2 (a) Explanation of the MDI keyboard Number Name Explanation 1 RESET key Press this key to reset the CNC, to cancel an alarm, etc. RESET 2 HELP key Press this button to use the help function when uncertain about t
- Page 63B-63784EN-1/01 OPERATION 2.OPERATIONAL DEVICES Table2.2 (a) Explanation of the MDI keyboard Number Name Explanation 10 Cursor move keys There are four different cursor move keys. : This key is used to move the cursor to the right or in the forward direction. The cursor is moved in short units in the
- Page 642.OPERATIONAL DEVICES OPERATION B-63784EN-1/01 2.3 OPERATION SCREEN DISPLAY The operation screens used in the CNC are classified into the following levels and managed hierarchically: - Function - Chapter Function 1 Function 2 Function Operation screen Operation screen Operation screen Operation scre
- Page 65B-63784EN-1/01 OPERATION 2.OPERATIONAL DEVICES 2.4 OPERATIONS SUPPORTED BY EACH OPERATION SCREEN The operation screens support a wide range of operations. On the program screen, for example, you can select and search for a desired program. On the setting screens, operations such as altering the sett
- Page 662.OPERATIONAL DEVICES OPERATION B-63784EN-1/01 2.5 FUNCTION KEYS AND SOFT KEYS 2.5.1 General Screen Operations 1 Press a function key on the MDI panel. The chapter selection soft keys that belong to the selected function appear. OFFSET POS PROG CUSTOM SETTING SYSTEM MESSAGE GRAPH 2 Press one of the
- Page 67B-63784EN-1/01 OPERATION 2.OPERATIONAL DEVICES 2.5.2 Function Keys Function keys are provided to select the type of screen to be displayed. The following function keys are provided on the MDI panel: POS Press this key to display the position screen. PROG Press this key to display the program screen.
- Page 682.OPERATIONAL DEVICES OPERATION B-63784EN-1/01 2.5.3 Soft Keys Instead of the function keys, soft keys can also be used to select the type of screen to be displayed. In addition, soft keys are used for actual operations. The subsequent sections show a function menu and chapter selection menus. NOTE
- Page 69B-63784EN-1/01 OPERATION 2.OPERATIONAL DEVICES 2.5.5 Chapter selection keys The function selection keys are used to select large items (functions). Each of them is further divided into smaller items (chapters). These items (chapters) are selected using chapter selection keys. To select a chapter, pr
- Page 702.OPERATIONAL DEVICES OPERATION B-63784EN-1/01 2.5.5.2 Program Function key on the MDI panel Soft keys PROG PROGRAM CHAPTER (1) (2) (3) (4) (5) (6) (7) (8) (9) (10) (11) (12) (13) (14) (15) (16) (17) (18) (19) No. Chapter menu Explanation (1) TEXT Selects the screen for displaying the contents of a
- Page 71B-63784EN-1/01 OPERATION 2.OPERATIONAL DEVICES 2.5.5.3 Offset/Setting Function key on the MDI panel Soft keys OFFSET OFFSET SETING CHAPTER (1) (2) (3) (4) (5) (6) (7) (8) (9) (10) (11) (12) (13) (14) (15) (16) (17) (18) (19) (21) (22) (23) (24) (25) (26) (27) (28) (29) No. Chapter menu Explanation (
- Page 722.OPERATIONAL DEVICES OPERATION B-63784EN-1/01 2.5.5.4 System Function key on the MDI panel Soft keys SYSTEM SYSTEM CHAPTER (1) (2) (3) (4) (5) (6) (7) (8) (9) (10) (11) (12) (13) (14) (15) (16) (17) (18) (19) (21) (22) (23) (24) (25) (26) (27) (28) (29) No. Chapter menu Explanation (1) PARAMETER Se
- Page 73B-63784EN-1/01 OPERATION 2.OPERATIONAL DEVICES 2.5.5.5 Messages Function key on the MDI panel Soft keys MESSAGE MESSAGE CHAPTER (1) (2) (3) (4) (5) (6) (7) (8) (9) (10) No. Chapter menu Explanation (1) ALARM Selects the alarm message screen. (2) OPERATOR Selects the operator message screen. (3) ETHE
- Page 742.OPERATIONAL DEVICES OPERATION B-63784EN-1/01 2.5.6 Key Input and Input Buffer 2.5.6.1 Inserting characters When an address and a numerical key are pressed, the character corresponding to that key is input once into the key input buffer. The contents of the key input buffer is displayed at the bott
- Page 75B-63784EN-1/01 OPERATION 2.OPERATIONAL DEVICES 2.5.6.2 Deleting characters Move the cursor to a position next to a character you want to delete, then press the CAN key. When the CAN key is pressed while the shift button is held down, the contents of the key input buffer are all deleted. Example Dele
- Page 762.OPERATIONAL DEVICES OPERATION B-63784EN-1/01 2.5.7 Warning Messages After a character or number has been input from the MDI panel, a data check is executed when key or a soft key is pressed. In the case of incorrect input data or the wrong operation a flashing warning message will be displayed on
- Page 77B-63784EN-1/01 OPERATION 2.OPERATIONAL DEVICES 2.6 LANGUAGE SELECTION The Japanese, English, German, French, Italian, Spanish, Swedish, and Chinese are prepared as display languages. Select the language to be displayed by parameters. Fig. 2.6 (a) Example of operation screen : JAPANESE Fig. 2.6 (b) E
- Page 782.OPERATIONAL DEVICES OPERATION B-63784EN-1/01 2.7 EXTERNAL I/O DEVICES Three types of external input/output devices are available. This section outlines each device. For details on these devices, refer to the corresponding manuals listed below. Table 2.7(a) External I/O device Max. Reference Device
- Page 79B-63784EN-1/01 OPERATION 2.OPERATIONAL DEVICES Parameter Before an external input/output device can be used, parameters must be set as follows. CNC MAIN CPU BOARD DISPLAY UNIT Channel 1 Channel 2 Channel 3 Channel 13 JD5A JD5B JD36A JD6A RS-232-C RS-232-C RS-232-C RS-422 Reader Reader Host Host punc
- Page 802.OPERATIONAL DEVICES OPERATION B-63784EN-1/01 2.7.1 FANUC Handy File The Handy File is an easy-to-use, multi function floppy disk input/output device designed for FA equipment. By operating the Handy File directly or remotely from a unit connected to the Handy File, programs can be transferred and
- Page 81B-63784EN-1/01 OPERATION 2.OPERATIONAL DEVICES 2.7.3 FANUC FA Card An FA Card is a memory card used as an input medium in the FA field. It is compact, but has a large memory capacity with high reliability, and requires no special maintenance. When an FA Card is connected to the CNC via the card adap
- Page 822.OPERATIONAL DEVICES OPERATION B-63784EN-1/01 2.8 POWER ON/OFF 2.8.1 Turning on the Power Procedure of turning on the power Procedure 1 Check that the appearance of the CNC machine tool is normal. (For example, check that front door and rear door are closed.) 2 Turn on the power according to the ma
- Page 83B-63784EN-1/01 OPERATION 2.OPERATIONAL DEVICES 2.8.2 Power Disconnection Power Disconnection Procedure 1 Check that the LED indicating the cycle start is off on the operator's panel. 2 Check that all movable parts of the CNC machine tool is stopping. 3 If an external input/output device such as the
- Page 843.MANUAL OPERATION OPERATION B-63784EN-1/01 3 MANUAL OPERATION MANUAL OPERATION are as follows : 3.1 Manual reference position return 3.2 Jog feed 3.3 Incremental feed 3.4 Manual handle feed 3.5 Manual feed in a specified direction 3.6 Manual numeric command 3.7 Manual absolute on and off 3.8 Effect
- Page 85B-63784EN-1/01 OPERATION 3.MANUAL OPERATION 3.1 MANUAL REFERENCE POSITION RETURN The tool is returned to the reference position as follows : The tool is moved in the direction specified in parameter ZMI (bit 5 of No. 1006) for each axis with the reference position return switch on the machine operat
- Page 863.MANUAL OPERATION OPERATION B-63784EN-1/01 Restrictions - Moving the tool again Once the REFERENCE POSITION RETURN COMPLETION LED lights at the completion of reference position return, the tool does not move unless the REFERENCE POSITION RETURN switch is turned off. - Reference position return comp
- Page 87B-63784EN-1/01 OPERATION 3.MANUAL OPERATION 3.2 JOG FEED In the jog mode, pressing a feed axis and direction selection switch on the machine operator's panel continuously moves the tool along the selected axis in the selected direction. The jog feedrate is specified in a parameter (No.1423) The jog
- Page 883.MANUAL OPERATION OPERATION B-63784EN-1/01 The above is an example. Refer to the appropriate manual provided by the machine tool builder for the actual operations. 0 2000 JOG FEED RATE OVERRIDE RAPID TRAVERSE OVERRIDE (%) F0 25 50 100 Limitations - Acceleration/deceleration for rapid traverse Feedr
- Page 89B-63784EN-1/01 OPERATION 3.MANUAL OPERATION 3.3 INCREMENTAL FEED In the incremental mode(s), pressing a feed axis and direction selection switch on the machine operator's panel moves the tool one step along the selected axis in the selected direction. Z Each time a switch is Tool pressed, the tool m
- Page 903.MANUAL OPERATION OPERATION B-63784EN-1/01 3.4 MANUAL HANDLE FEED In the handle mode, the tool can be minutely moved by rotating the manual pulse generator on the machine operator's panel. Select the axis along which the tool is to be moved with the handle feed axis selection switches. The minimum
- Page 91B-63784EN-1/01 OPERATION 3.MANUAL OPERATION Explanation - When a manual handle feed faster than the rapid traverse rate is specified When a handle feed faster than the rapid traverse rate is specified, the command pulses up to the permissible flow amount set in parameter No. 1413 are accumulated in
- Page 923.MANUAL OPERATION OPERATION B-63784EN-1/01 3.5 MANUAL FEED IN A SPECIFIED DIRECTION The tool can be manually moved in a specified direction on a specified plane. The feedrate and the direction and plane of feed can be changed at any time. Simple cutting can be manually executed on a plane. Explanat
- Page 93B-63784EN-1/01 OPERATION 3.MANUAL OPERATION - Starting and stopping manual feed in the specified direction Manual feed in the specified direction is executed while the corresponding signals are “1”. The signal that moves the tool in the specified direction and the signal that moves it in the opposit
- Page 943.MANUAL OPERATION OPERATION B-63784EN-1/01 3.6 MANUAL NUMERIC COMMAND The manual numeric command function allows data programmed by MDI to be executed in the jog mode. Whenever the system is ready for jog feed, a manual numeric command can be executed. The following eight functions are supported: (
- Page 95B-63784EN-1/01 OPERATION 3.MANUAL OPERATION The following data can be set: 1. G00 : Positioning 2. G01 : Linear interpolation 3. G28 : Automatic reference point return 4. G30 : 2nd, 3rd or 4th reference position return 5. M codes : Miscellaneous functions 6. S codes : Spindle functions 7. T codes :
- Page 963.MANUAL OPERATION OPERATION B-63784EN-1/01 Explanation - Positioning The amount of travel is given as a numeric value, preceded by an address such as X, Y or Z. This is always regarded as being an incremental command, regardless of whether G90 or G91 is specified. The tool moves along each axis ind
- Page 97B-63784EN-1/01 OPERATION 3.MANUAL OPERATION - Automatic reference position return (G28) The tool returns directly to the reference position without passing through any intermediate points, regardless of the specified amount of travel. For axes for which no move command is specified, however, a retur
- Page 983.MANUAL OPERATION OPERATION B-63784EN-1/01 - T codes (tool functions) After address T, specify a numeric value of no more than the number of digits specified by parameter No. 2032. NOTE Subprogram calls cannot be performed using T codes. - B codes (second auxiliary functions) After address B, speci
- Page 99B-63784EN-1/01 OPERATION 3.MANUAL OPERATION - Erasing data (1) When soft key [CLEAR] is pressed, followed by soft key [EXEC], all set data is cleared. In this case, however, the G codes are set to G00 or G01 according to the setting of bit 0 (G01) of parameter No. 2401. Data can also be cleared by p
- Page 1003.MANUAL OPERATION OPERATION B-63784EN-1/01 - Jog feed When a manual numeric command is specified while the tool is being moved along an axis by using a feed axis and direction selection switch, the axial movement is interrupted, and the manual numeric command is executed. For this reason, the tool
- Page 101B-63784EN-1/01 OPERATION 3.MANUAL OPERATION 3.7 MANUAL ABSOLUTE ON AND OFF Whether the distance the tool is moved by manual operation is added to the coordinates can be selected by turning the manual absolute switch on or off on the machine operator's panel. When the switch is turned on, the distanc
- Page 1023.MANUAL OPERATION OPERATION B-63784EN-1/01 Explanation The following describes the relation between manual operation and coordinates when the manual absolute switch is turned on or off, using a program example. G01G90 X100.0Y100.0F100 ; (1) X200.0Y150.0 ; (2) X300.0Y200.0 ; (3) The subsequent figur
- Page 103B-63784EN-1/01 OPERATION 3.MANUAL OPERATION - Manual operation after a feed hold Coordinates when the feed hold button is pressed while block (2) is being executed, manual operation (Y-axis + 75.0) is performed, and the cycle start button is pressed and released. Y 300.0 (300.0 , 275.0) (200.0 , 225
- Page 1043.MANUAL OPERATION OPERATION B-63784EN-1/01 - When reset after a manual operation following a feed hold Coordinates when the feed hold button is pressed while block (2) is being executed, manual operation (Y-axis +75.0) is performed, the control unit is reset with the RESET button, and block (2) is
- Page 105B-63784EN-1/01 OPERATION 3.MANUAL OPERATION - When a movement command in the next block is only one axis When there is only one axis in the following command, only the commanded axis returns. Y Program 300.0 N1 G90 G01 X100. Y100. F500 ; N2 X200.0 ; N3 Y150.0 ; 200.0 (200.0 , 150.0) (200.0 , 100.0)
- Page 1063.MANUAL OPERATION OPERATION B-63784EN-1/01 When the switch is ON during cutter compensation Operation of the machine upon return to automatic operation after manual intervention with the switch is ON during execution with an absolute command program in the cutter compensation mode will be described
- Page 107B-63784EN-1/01 OPERATION 3.MANUAL OPERATION After manual intervention is performed when the execution of a block has been terminated by single block stop, the tool also moves so that the tool center moves towards the end of the next vector in the program. An MDI operation can also be intervened as w
- Page 1083.MANUAL OPERATION OPERATION B-63784EN-1/01 3.8 EFFECT OF MANUAL INTERVENTION Section 4.7, "Manual Absolute On and Off," describes the effect of manual intervention on the execution of the remaining part of the program. This section describes in detail the relationship between manual intervention an
- Page 109B-63784EN-1/01 OPERATION 3.MANUAL OPERATION 3.9 THREE-DIMENSIONAL HANDLE FEED Three-dimensional handle feed includes three special handle feed modes, a function for changing the tool length compensation in the longitudinal direction of the tool, and two screen display functions. The three-dimensiona
- Page 1103.MANUAL OPERATION OPERATION B-63784EN-1/01 3.9.1 Handle Feed Interruption in the Longitudinal Direction of the Tool Select the mode of handle feed in the longitudinal direction of the tool and rotate the handle of the manual pulse generator. The tool rotates about the rotation axis, causing the sla
- Page 111B-63784EN-1/01 OPERATION 3.MANUAL OPERATION Explanation - Pulses distributed to each axis When handle feed/interruption in the longitudinal direction of the tool is performed, pulses are distributed to the axes according to the machine configuration as explained below. - Rotary axes B and C (with th
- Page 1123.MANUAL OPERATION OPERATION B-63784EN-1/01 - Rotary axes A and B (with the X-axis representing the tool axis) X Xp Hp B Zp Z Yp A Y Xp=Hp×cos(B) Yp=Hp×sin(B)×sin(A) Zp= -Hp×sin(B)×cos(A) -Rotary axes A and B (with the A-axis being the master and the Z-axis representing the tool axis) Z B Hpz A HPzb
- Page 113B-63784EN-1/01 OPERATION 3.MANUAL OPERATION -Rotation axes A and B (with the B-axis being the master axis and the Z-axis representing the tool axis) Z A Hpz B Hpza Zp Y X Xp Yp Hpz : Hp when the machine position of the A-axis is 0 and the machine position of the B-axis is 0 Hpza: Hp when rotation is
- Page 1143.MANUAL OPERATION OPERATION B-63784EN-1/01 3.9.2 Handle Feed in the Transverse Direction of the Tool Select the mode of handle feed in the transverse direction of the tool and rotate the handle of the manual pulse generator. The tool rotates about the rotation axis, causing the slanted tool to move
- Page 115B-63784EN-1/01 OPERATION 3.MANUAL OPERATION Explanation - Pulses distributed to each axis When handle feed/interruption in the transverse direction of the tool is performed, pulses are distributed to the axes according to the machine configuration as explained below. - Rotation axes B and C (with th
- Page 1163.MANUAL OPERATION OPERATION B-63784EN-1/01 - Rotation axes A and C (with the Z-axis representing the tool axis) - When handle feed is performed in the transverse direction of the tool (in the X-axis direction) Z A Hp (X direction) Yp Xp Y C X When three-dimensional handle feed in the transverse dir
- Page 117B-63784EN-1/01 OPERATION 3.MANUAL OPERATION - Rotation axes A and B (with the X-axis representing the tool axis) - When handle feed is performed in the transverse direction of the tool (in the Y-axis direction) X B Hp(Y direction) Zp Yp Z A Y When three-dimensional handle feed in the transverse dire
- Page 1183.MANUAL OPERATION OPERATION B-63784EN-1/01 3.9.3 Rotational Handle Feed and Interruption Around the Center of the Tool Tip Select the mode of rotational handle feed around the center of the tool tip and rotate the handle of the manual pulse generator. When the rotation axis (A-, B-, or C-axis) is m
- Page 119B-63784EN-1/01 OPERATION 3.MANUAL OPERATION - Rotation axes B and C (with the Z-axis representing the tool axis) Z Bp Zp T1 Yp T2 B Y Xp C X Cp T1 :Tool rotation center position T2 :Tool rotation center position after movement Bp, Bp, Cp :Angular displacement of the rotation axis Movement amount of
- Page 1203.MANUAL OPERATION OPERATION B-63784EN-1/01 - Rotation axes A and B (with the X-axis representing the tool axis) X Bp Xp T1 Zp T2 B Z A Yp Y Ap T1 : Tool rotation center position T2 : Tool rotation center position after movement Ap, Bp : Angular displacement of the rotation axis Movement amount of l
- Page 121B-63784EN-1/01 OPERATION 3.MANUAL OPERATION 3.9.4 Control Point Compensation in Three-dimensional Handle Feed Overview Control point compensation in three-dimensional handle feed permits three-dimensional handle feed even in machine configurations such as those described below. For an explanation of
- Page 1223.MANUAL OPERATION OPERATION B-63784EN-1/01 Control point compensation in tool head center rotation handle feed If the tool head center rotation handle mode is selected and the tool is rotated about a rotation axis (either axis A or B, or axis C) using the manual pulse generator, the tool moves alon
- Page 123B-63784EN-1/01 OPERATION 3.MANUAL OPERATION 3.10 CHANGING TOOL LENGTH COMPENSATION IN THE LONGITUDINAL DIRECTION OF THE TOOL Select the mode of changing the tool length compensation in the longitudinal direction of tool when both the following modes are selected: Mode of tool length compensation in
- Page 1243.MANUAL OPERATION OPERATION B-63784EN-1/01 3.11 TOOL HOLDER OFFSET The length unique to the machine tool from the rotation center of a rotary axis (A and B axes, A and C axes, B and C axes) around which the tool axis rotates to the tool mounting position is called the "tool holder offset." This too
- Page 125B-63784EN-1/01 OPERATION 4.MANUAL OPERATION 3.12 ROTARY AXIS ORIGIN COMPENSATION AND ROTARY AXIS OFFSET Explanation - Rotary axis origin compensation When a rotary axis deviates slightly due to thermal displacement, the deviation of the origin of the rotary axis can be set in parameter No. 7518 to p
- Page 1264.MANUAL OPERATION OPERATION B-63784EN-1/01 3.13 PRECAUTIONS DURING 3-DIMENSIONAL HANDLE FEED 1 Interruption by 3-dimensional handle feed/interruption function is effective when manual handle interruption is added on at the same time. 2 When performing interruption by the 3-dimensional handle, rotar
- Page 127B-63784EN-1/01 OPERATION 4.MANUAL OPERATION (2) Tool direction Z axis, rotary axes B and C axes B C Z Workpiece C B Y X (3) Tool direction X axis, rotary axes A and B axes A B Z A Workpiece X B Y - 105 -
- Page 1284.MANUAL OPERATION OPERATION B-63784EN-1/01 (4) Tool direction Z axis, rotary axes A and B axes (A-axis master) A B Z Y B Workpiece X A (5) Tool direction Z axis, rotary axes A and B axes (B-axis master) B A Z Workpiece B X Y A - 106 -
- Page 129B-63784EN-1/01 OPERATION 4.MANUAL OPERATION 4 Only the first manual pulse generator can be used in the 3- dimensional handle feed/interruption mode. 5 Tool feed directions by tool direction handle feed/interruption and by tool normal direction handle feed/interruption are determined when the 3-dimen
- Page 1304.MANUAL OPERATION OPERATION B-63784EN-1/01 3.14 DISPLAYING THE COORDINATES OF THE TOOL TIP The absolute coordinates of the tool tip and the actual speed are displayed when handle feed in the longitudinal or transverse direction of the tool or rotational handle feed around the center of the tool tip
- Page 131B-63784EN-1/01 OPERATION 4.MANUAL OPERATION Tool tip coordinates display screen Follow the procedure described in Section II-2.3 and II-2.5, "Displaying Tool Tip Coordinate Display Screen" to display the tool tip coordinate display screen shown below. Display data - Tool Head Position The axis addre
- Page 1324.MANUAL OPERATION OPERATION B-63784EN-1/01 3.15 DISPLAYING PULSE VALUES AND AMOUNT OF MOVEMENT BY MANUAL INTERRUPT The amount of a handle interrupt is displayed for each of the functions including handle feed in the longitudinal direction of the tool, handle feed in the transverse direction of the
- Page 133B-63784EN-1/01 OPERATION 4.MANUAL OPERATION - RIGHT DIR The amount of handle pulse interrupt in the mode of handle feed/interrupt in the transverse direction of the tool is indicated in units of the least input increment of a target axis for movement. - Tip center The amount of handle pulse interrup
- Page 1344.MANUAL OPERATION OPERATION B-63784EN-1/01 3.16 MANUAL INTERRUPTION FUNCTION FOR THREE-DIMENSIONAL COORDINATE CONVERSION When the handle of the manual pulse generator is rotated in the three- dimensional coordinate conversion mode, this function adds the travel distance specified by the manual puls
- Page 135B-63784EN-1/01 OPERATION 4.MANUAL OPERATION 7 When feed in the tool axis direction or the direction perpendicular to the tool axis or rotation around the tool tip center is not selected for the manual operation or the manual interruption using the manual pulse generator when the ALNGH, RGHTH, and RN
- Page 1364.AUTOMATIC OPERATION OPERATION B-63784EN-1/01 4 AUTOMATIC OPERATION Programmed operation of a CNC machine tool is referred to as automatic operation. This chapter explains the following types of automatic operation: - MEMORY OPERATION Operation by executing a program registered in CNC memory - MDI
- Page 137B-63784EN-1/01 OPERATION 4.AUTOMATIC OPERATION 4.1 DNC OPERATION In the DNC operation mode, automatic operation is carried out while a program is read from an external I/O device via the interface. When a floppy format external I/O device (Handy File, Floppy Cassette, FA Card) is connected, it is po
- Page 1384.AUTOMATIC OPERATION OPERATION B-63784EN-1/01 4.2 MEMORY OPERATION In the memory operation mode, automatic operation is performed according to a program stored in memory in advance. When the Cycle Start button on the machine operator's panel is pressed after the program to execute is selected, memo
- Page 139B-63784EN-1/01 OPERATION 4.AUTOMATIC OPERATION 4.3 MDI OPERATION In MDI mode, a program of up to 256 characters can be created and executed from MDI in the same way as for normal programs. MDI mode is used for simple test operation. The FS15 type or FS16 type can be selected by setting bit 0 (M16) o
- Page 1404.AUTOMATIC OPERATION OPERATION B-63784EN-1/01 Programs created in MDI cannot be registered. - Subprogram nesting A subprogram call command (M98) can be specified in a program created in MDI. This means that a program registered in memory can be called and executed by MDI operation. Up to ten nestin
- Page 141B-63784EN-1/01 OPERATION 4.AUTOMATIC OPERATION MDI operation program (for the FS16 type) - Program erasure A program created in MDI mode is erased when: - M02, M30, or ER (%) is executed as part of MDI operation. - If bit 6 (MZE) of parameter No. 2458 is set to 1, the last block in the program has b
- Page 1424.AUTOMATIC OPERATION OPERATION B-63784EN-1/01 4.4 SELECTION OF EXECUTION PROGRAMS This section describes how to select a program to be executed (execution program) from among multiple programs and how to rewind the program to the top of the program. 4.4.1 Program Number Search Search for the execut
- Page 143B-63784EN-1/01 OPERATION 4.AUTOMATIC OPERATION 4.4.2 Search by Sequence Number A selected program is searched for a block by sequence number. This function is used when a program is to be started or restarted from a block having a specified sequence number. Search by sequence number is performed on
- Page 1444.AUTOMATIC OPERATION OPERATION B-63784EN-1/01 4.4.3 Rewind Rewind searches the top of the execution program. This is used for starting the program from the top of the program. Rewind is performed in the program screen - Mode selection If memory operation is in operation, select the MEMORY mode. - R
- Page 145B-63784EN-1/01 OPERATION 4.AUTOMATIC OPERATION 4.5 EXECUTING AUTOMATIC OPERATION While executing a block, the CNC usually calculates the next block to convert it into data in the executable form. This is called buffering. After automatic operation is started, the following are executed: 1 A one-bloc
- Page 1464.AUTOMATIC OPERATION OPERATION B-63784EN-1/01 4.6 STOP/TERMINATION OF AUTOMATIC OPERATION Automatic operation can be stopped/terminated by specifying a stop/termination instruction at a desired position in a program. Automatic operation can also be stopped by using a switch on the operator's panel.
- Page 147B-63784EN-1/01 OPERATION 4.AUTOMATIC OPERATION - Single-block stop according to the comparison between sequence numbers When the program contains a block having the same sequence number as the preset sequence number while the program is being executed, the block is executed, then the system enters t
- Page 1484.AUTOMATIC OPERATION OPERATION B-63784EN-1/01 Example N1 G91; N2 G81X1000Y1000R-5000Z-2000F100; N3 X1000Y1000L3; . . G80; . In this example, the cycle of block N3 is executed three times, then the system enters the single-block stop state. - 126 -
- Page 149B-63784EN-1/01 OPERATION 4.AUTOMATIC OPERATION 4.7 PROGRAM RESTART This function specifies Sequence No. of a block (number of blocks between the top of the program and the block to be restarted) to be restarted when a tool is broken down or when it is desired to restart machining operation after a d
- Page 1504.AUTOMATIC OPERATION OPERATION B-63784EN-1/01 Procedure for Program Restart by Specifying a Sequence Number Procedure 1 [ P TYPE ] 1 Retract the tool and replace it with a new one. When necessary, change the offset. (Go to step 2.) [ Q TYPE ] 1 When power is turned ON or emergency stop is released,
- Page 151B-63784EN-1/01 OPERATION 4.AUTOMATIC OPERATION [ Q TYPE ] 1 Turn the program restart switch on the machine operator's panel ON. Q x x x x x x x x [EXEC] 2 Press PROG key to display the desired program. 3 Find the program head. Sequence number 4 Press the [PROGRAM RESTART] soft key then the [(Q_SEQ#)
- Page 1524.AUTOMATIC OPERATION OPERATION B-63784EN-1/01 Procedure 3 [COMMON TO P TYPE/Q TYPE] 1 The sequence number is searched for, and the program restart screen is displayed. Fig4.7 (a) DESTINATION shows the position where machining is to restart. DISTANCE TO GO shows the distance from the current tool po
- Page 153B-63784EN-1/01 OPERATION 4.AUTOMATIC OPERATION 5 Press the Cycle Start button. The moves to the machining restart position at the dry run feedrate sequentially along axes in the order specified by parameter setting No. 7110. Machining is then restarted. Procedure for Program Restart by Specifying a
- Page 1544.AUTOMATIC OPERATION OPERATION B-63784EN-1/01 [Q TYPE] 1 Turn the program restart switch on the machine operator's panel ON. 2 Press PROG key to display the desired program. QB x x x x x x x x [EXEC] 3 Find the program head. Block number 4 Press the [PROGRAM RESTART] soft key then [(Q_BLK#)] soft k
- Page 155B-63784EN-1/01 OPERATION 4.AUTOMATIC OPERATION Codes are displayed in the order in which they are specified. All codes are cleared by a program restart command or cycle start in the reset state. 2 Turn the program restart switch OFF. 3 Check the screen for M, S, T and B codes to be executed. If they
- Page 1564.AUTOMATIC OPERATION OPERATION B-63784EN-1/01 - Storing / clearing the block number The block number is held in memory while no power is supplied. The number can be cleared by cycle start in the reset state. - Block number when a program is halted or stopped The program screen usually displays the
- Page 157B-63784EN-1/01 OPERATION 4.AUTOMATIC OPERATION - During search Search operation must be performed under the same conditions including input signal and offset conditions as those used for machining. Otherwise, return to the correct machining restart position cannot be made. Note that even when the si
- Page 1584.AUTOMATIC OPERATION OPERATION B-63784EN-1/01 Alarm Number Message Contents SR0592 END OF RECORD The EOR (End of Record) code is specified in the middle of a block. This alarm is also generated when the percentage at the end of the NC program is read. This alarm is also generated when the specified
- Page 159B-63784EN-1/01 OPERATION 4.AUTOMATIC OPERATION The previously specified values are used as the common variables when restarting the program. The variables are not automatically preset. The necessary common variables are therefore initialized to the values used for the previous automatic operation im
- Page 1604.AUTOMATIC OPERATION OPERATION B-63784EN-1/01 4.8 OUTPUT OF PROGRAM RESTART M, S, T AND B CODES The following operations are possible after searching the program execution restart block. 1 Before moving to the machining restart position (1) The final M, S, T and B codes can be automatically output
- Page 161B-63784EN-1/01 OPERATION 4.AUTOMATIC OPERATION Output of all M codes and final S, T and B codes If the Cycle Start button is pressed after the program execution restart block is searched when bit 6 (MOA) of parameter No. 7620 is set to "1", all sampled M codes and final S, T and B codes are automati
- Page 1624.AUTOMATIC OPERATION OPERATION B-63784EN-1/01 2 When the [OVERSTORE] soft key is pressed before the tool reaches the machining restart position, overstore mode is set, allowing the input of the displayed M, S, T, and B codes in the overstore field on the screen. To set the overstore mode while the
- Page 163B-63784EN-1/01 OPERATION 4.AUTOMATIC OPERATION 4.9 BLOCK RESTART The block restart function makes it possible to restart automatic operation at the start point or another point of the block in which automatic operation was interrupted due to an error such as tool breakage. Restart block procedure Be
- Page 1644.AUTOMATIC OPERATION OPERATION B-63784EN-1/01 Procedure 3 1 Return the mode selection switch to the mode that was active before automatic operation was interrupted. The block return switch turns ON if it was OFF. (The letters "RSTR" may be displayed or blink on the status line of the screen dependi
- Page 165B-63784EN-1/01 OPERATION 4.AUTOMATIC OPERATION Fig. 4.9(a) (i) (DESTINATION) : Absolute coordinates of the tool center at the start point of the interrupted block (ii) (DISTANCE TO GO) : Distance from the current position (ABSOLUTE) of the tool to the start point (DESTINATION) of the interrupted blo
- Page 1664.AUTOMATIC OPERATION OPERATION B-63784EN-1/01 CAUTION 1 When returning the tool to the start point of the block by a manual operation using the block restart function, the tool is returned to the tip of the vector vertical to the block at its start point. Therefore, if the start point of the interr
- Page 167B-63784EN-1/01 OPERATION 4.AUTOMATIC OPERATION CAUTION 2 When the tool movement is interrupted during a canned drilling cycle, after which block restart is performed, the tool does not return to the point at which tool movement was interrupted as shown in the figures below. In either case, care must
- Page 1684.AUTOMATIC OPERATION OPERATION B-63784EN-1/01 - Restart of automatic operation with the block return switch turned on If the cycle start button is pressed while the block return switch is on, the tool length compensation value and the cutter compensation value are recalculated, and automatic operat
- Page 169B-63784EN-1/01 OPERATION 4.AUTOMATIC OPERATION - Block restart interference check The block restart interference check is made based on the value (d: permissible block restart interference check value) set in parameter No. 7651. The interference check issues an alarm unless the distance between the
- Page 1704.AUTOMATIC OPERATION OPERATION B-63784EN-1/01 - In three-dimensional cutter compensation mode In the three-dimensional cutter compensation mode with zero value, suppose the tool movement is interrupted, the compensation value is changed, and the operation is restarted. In this case, the vector for
- Page 171B-63784EN-1/01 OPERATION 4.AUTOMATIC OPERATION 4.10 TOOL WITHDRAWAL AND RETURN The tool can be withdrawn from a workpiece in order to replace the tool when it is damaged during machining, or merely to check the status of machining. The tool can then be advanced again to restart machining efficiently
- Page 1724.AUTOMATIC OPERATION OPERATION B-63784EN-1/01 Procedure2 Retract Suppose that the TOOL WITHDRAW switch on the machine operator's panel is turned on when the tool is positioned at point A during execution of the N30 block. Machine operator's panel TOOL RETRAC- BEING TION WITH- POSITION DRAWN A TOOL
- Page 173B-63784EN-1/01 OPERATION 4.AUTOMATIC OPERATION Procedure3 Withdrawal Set the manual operation mode, then withdraw the tool. For manual operation, either jog feed or handle feed is possible. 11 12 10 9 8 3 4 7 2 5 6 Z E point 1 A point X Y Procedure4 Return After withdrawing the tool and any addition
- Page 1744.AUTOMATIC OPERATION OPERATION B-63784EN-1/01 During return operation, the CRT screen displays “PTRR” and “MSTR”. - “PTRR” blinks in the field for indicating states such as program editing status. - “MSTR” is displayed in the automatic operation status field. - “MTN” is displayed in the field for i
- Page 175B-63784EN-1/01 OPERATION 4.AUTOMATIC OPERATION Explanation 1Retraction - When no retraction distance is specified If no retraction distance or direction required for retraction are specified, retraction is not performed when the TOOL WITHDRAW switch on the operator's panel is turned on. Instead, the
- Page 1764.AUTOMATIC OPERATION OPERATION B-63784EN-1/01 - Reset Upon reset, memorized position data is lost and the tool withdraw mode is cancelled. NOTE Simultaneous automatic/manual operations are impossible in the tool retraction mode. If they are selected, manual operation such as jog feed, incremental f
- Page 177B-63784EN-1/01 OPERATION 4.AUTOMATIC OPERATION Explanation 5Tool retract and return after thread cutting - Difference with regular command 1. Retract moves the tool off the workpiece between the retract- specified axis and the thread cutting axis. 2. After the tool is retracted, a single block not c
- Page 1784.AUTOMATIC OPERATION OPERATION B-63784EN-1/01 (1) When the remaining thread cutting amount ≥ retract amount Retract position d a Retract amount c A 45° b When the tool does not travel beyond thread cutting end point (c), where the tool moves off the workpiece at an angle of 45° by the retract amoun
- Page 179B-63784EN-1/01 OPERATION 4.AUTOMATIC OPERATION 4. After the tool has been retracted, the next block not containing the thread cutting command is executed and program execution is halted. Point E d a Retract position c b In this example, as the first block not containing the thread cutting command is
- Page 1804.AUTOMATIC OPERATION OPERATION B-63784EN-1/01 5. Repositioning returns the tool to the program execution position in the first block not containing the thread cutting command. Repositioning Point E d N 50 a Retract point c b In this example, the positioning point is d. Automatic operation after rep
- Page 181B-63784EN-1/01 OPERATION 4.AUTOMATIC OPERATION (i) If the switch is turned on during motion 1, the tool is moved retracted by the distance specified by G10.6, as in ordinary retraction. (ii) If the switch is turned on during motion 2, the motion is suspended and the tool moves to the initial point a
- Page 1824.AUTOMATIC OPERATION OPERATION B-63784EN-1/01 Explanation 7 Combining the block restart function and the retraction and recovery function The procedure for combining the tool retraction and recovery and block restart functions is shown following. See Item II-4.9 for the block restart function. If t
- Page 183B-63784EN-1/01 OPERATION 4.AUTOMATIC OPERATION Limitation 1. After the retraction position is specified with G10.6 using an absolute command, any changes in the origin, preset, and workpiece origin offset (or external workpiece origin offset) will not be reflected in the retraction position. If, the
- Page 1844.AUTOMATIC OPERATION OPERATION B-63784EN-1/01 4.11 RETRACE The retrace function enables the tool to retrace the path of movement so far. It also returns the tool along the same path once again. When the tool returns to the point where it started retracing its path, it continues machining as directe
- Page 185B-63784EN-1/01 OPERATION 4.AUTOMATIC OPERATION In the case of 2) above, the tool starts reverse movement at the position of a single block stop when the cycle start switch is pressed. Single block stop REVERSE switch turned on cycle start Cycle start Forward movement (forward movement started) Rever
- Page 1864.AUTOMATIC OPERATION OPERATION B-63784EN-1/01 In the case of 2) above, the tool starts forward return movement at the position of a single block stop when the cycle start switch is pressed. Cycle start Reverse movement started (forward movement started) Forward movement started Forward movement For
- Page 187B-63784EN-1/01 OPERATION 4.AUTOMATIC OPERATION - Forward return movement → Forward movement When the tool completes a forward return movement up to the block where reverse movement was started, the tool automatically resumes forward movement. Programmed commands are read and program execution is con
- Page 1884.AUTOMATIC OPERATION OPERATION B-63784EN-1/01 - Reset Upon reset (when the RESET key on the MDI panel is pressed, the external reset signal is applied, or the reset and rewind signal is applied), the memorized reverse movement blocks are cleared. - Feedrate A feedrate for reverse movement can be sp
- Page 189B-63784EN-1/01 OPERATION 4.AUTOMATIC OPERATION - Start of reverse movement and forward return movement after single block halt Reverse movement or forward return movement can be restarted after a single block halt by switching the reverse movement signal and restarting program execution. - Dwell (G0
- Page 1904.AUTOMATIC OPERATION OPERATION B-63784EN-1/01 - Positioning (G00) When the tool is positioned based on nonlinear interpolation by setting bit 4 (LRP) of parameter No. 1400 to 0, the path of the tool for reverse movement does not match the path for forward movement. The path for forward return movem
- Page 191B-63784EN-1/01 OPERATION 4.AUTOMATIC OPERATION - Single block halt position Blocks created internally by the control unit contain a single block when reverse movement is performed. 3 4 Path after offset 2 5 Programmed path (2) Fig. 4.11 (l) Tool path after cutter compensation In the above example, a
- Page 1924.AUTOMATIC OPERATION OPERATION B-63784EN-1/01 - Changing the tool offset value Even if the cutter radius or length offset values are changed during reverse movement and forward return movement, the changes to the tool offset values are not effective until reverse movement and regular operation is r
- Page 193B-63784EN-1/01 OPERATION 4.AUTOMATIC OPERATION - Custom macro operation All custom macro operations are ignored in reverse movement and forward return movement. - Tool withdrawal and return function The tool cannot move along the path retraction or repositioning performed using the tool withdrawal a
- Page 1944.AUTOMATIC OPERATION OPERATION B-63784EN-1/01 4.12 ACTIVE BLOCK CANCEL Part programs can be halted, and the remaining amount of tool movement in the currently executing block can be canceled by pressing the active block cancel switch on the machine operator's panel. Though this halts automatic oper
- Page 195B-63784EN-1/01 OPERATION 4.AUTOMATIC OPERATION - Cutter compensation The tool path after cutter compensation is calculated from the block following the position where the tool stopped and from the subsequent block. The tool moves as follows when program execution is restarted after cutter compensati
- Page 1964.AUTOMATIC OPERATION OPERATION B-63784EN-1/01 4.13 MANUAL HANDLE INTERRUPT In automatic operation, this function allows a move command generated by the manual pulse generator to be superimposed on a programmed move command. As a result, the actual tool path deviates from the programmed path by the
- Page 197B-63784EN-1/01 OPERATION 4.AUTOMATIC OPERATION (5) If the direction of movement is reversed as a result of a manual handle interrupt, backlash compensation is applied. In this case, pitch error compensation is applied to the position set after the interrupt. (6) For a manual handle interrupt, the ap
- Page 1984.AUTOMATIC OPERATION OPERATION B-63784EN-1/01 - Position display 1 The following table shows the relationship between movement by handle interruption and position display data: Display Relation The absolute coordinate value does not Absolute coordinate value change by handle interruption. The relat
- Page 199B-63784EN-1/01 OPERATION 4.AUTOMATIC OPERATION 4.14 MANUAL INTERVENTION AMOUNT RETURN DURING AUTOMATIC OPERATION Explanation The manual intervention amount can be input during automatic operation without having to halt automatic operation. The manual intervention amounts for all axes are returned ac
- Page 2004.AUTOMATIC OPERATION OPERATION B-63784EN-1/01 4.15 SIMULTANEOUS AUTOMATIC AND MANUAL OPERATION In the simultaneous automatic and manual mode, for example, cutting along an axis can be interrupted to change the depth of cut on that axis, or the next workpiece can be set up during automatic operation
- Page 201B-63784EN-1/01 OPERATION 4.AUTOMATIC OPERATION - Manual operation Automatic operation during simultaneous automatic and manual operation is the same as ordinary automatic operation. Therefore, the following explains manual operation during simultaneous automatic and manual operation. - Simultaneous
- Page 2024.AUTOMATIC OPERATION OPERATION B-63784EN-1/01 - Relationship with signals The operation is related to signals as listed below: Table 4.15(c) Interrupt type Setup type Absolute on/off Not affected Affected (always off) Interlock Affected. If the signal is on, operation is not carried out. Machine lo
- Page 203B-63784EN-1/01 OPERATION 5.TEST OPERATION 5 TEST OPERATION The following functions are used to check before actual machining whether the machine operates as specified by the created program. 5.1 Machine Lock and Auxiliary Function Lock 5.2 Dry Run 5.3 Single Block - 181 -
- Page 2045.TEST OPERATION OPERATION B-63784EN-1/01 5.1 MACHINE LOCK AND AUXILIARY FUNCTION LOCK To display the change in the position without moving the tool, use machine lock. There are two types of machine lock: all-axis machine lock, which stops the movement along all axes, and specified-axis machine lock
- Page 205B-63784EN-1/01 OPERATION 5.TEST OPERATION Limitation - M, S, T, B command by only machine lock M, S, T and B commands are executed in the machine lock state. - Reference position return under Machine When a G27, G28, or G30 command is issued in the machine lock state, the command is accepted but the
- Page 2065.TEST OPERATION OPERATION B-63784EN-1/01 5.2 DRY RUN The tool is moved at the feedrate specified by a parameter regardless of the feedrate specified in the program. This function is used for checking the movement of the tool under the state that the workpiece is removed from the table. Tool Table F
- Page 207B-63784EN-1/01 OPERATION 5.TEST OPERATION Rapid traverse Positioning type Programmed command button #4(LRP of parameter For rapid traverse For cutting feed(*2) (RT signal) No.1400) The dry run feedrate × the maximum RT=ON LRP=0/1 Rapid traverse rate manual feedrate override value LRP=0 Jog feedrate
- Page 2085.TEST OPERATION OPERATION B-63784EN-1/01 5.3 SINGLE BLOCK Pressing the single block switch starts the single block mode. When the cycle start button is pressed in the single block mode, the tool stops after a single block in the program is executed. Check the program in the single block mode by exe
- Page 209B-63784EN-1/01 OPERATION 5.TEST OPERATION - Single block during a canned cycle In a canned cycle, the single block stop points are the end of 1 , 2 , and 6 shown below. When the single block stop is made after the point 1 or 2 , the feed hold LED lights. 1 2 6 Rapid traverse 3 Feed 5 4 Fig.5.3 (b) S
- Page 2106.SAFETY FUNCTIONS OPERATION B-63784EN-1/01 6 SAFETY FUNCTIONS To immediately stop the machine for safety, press the Emergency stop button. To prevent the tool from exceeding the stroke ends, Overtravel check and Stroke check are available. This chapter describes emergency stop., overtravel check, a
- Page 211B-63784EN-1/01 OPERATION 6.SAFETY FUNCTIONS 6.1 EMERGENCY STOP If you press Emergency Stop button on the machine operator's panel, the machine movement stops in a moment. Red EMERGENCY STOP Fig.6.1 Emergency stop For how to use the emergency stop button, see the manual provided by the machine tool b
- Page 2126.SAFETY FUNCTIONS OPERATION B-63784EN-1/01 6.2 OVERTRAVEL When the tool tries to move beyond the stroke end set by the machine tool limit switch, the tool decelerates and stops because of working the limit switch and an OVER TRAVEL is displayed. Deceleration and stop Y X Stroke end Limit switch Fig
- Page 213B-63784EN-1/01 OPERATION 6.SAFETY FUNCTIONS - Alarm Number Message Contents OT0007 + OVERTRAVEL ( HARD ) The stroke limit switch in the positive direction was triggered. This alarm is generated when the machine reaches the stroke end. When this alarm is not generated, feed of all axes is stopped dur
- Page 2146.SAFETY FUNCTIONS OPERATION B-63784EN-1/01 6.3 STROKE CHECK Two areas which the tool cannot enter can be specified with stored stroke check 1 and stored stroke check 2. (X,Y,Z) (I,J,K) (1) Forbidden area is inside. (X,Y,Z) (I,J,K) (2) Forbidden area is outside : Forbidden area for the tool Fig.6.3
- Page 215B-63784EN-1/01 OPERATION 6.SAFETY FUNCTIONS G 22X_Y__I_J_K_; (X,Y,Z) (I,J,K) X>I,Y>J,Z>K X-I>ζ (I least command increment) Y-J>ζ (In lest commandincrement) Z-K ζ (In least comand increment) F ζ ( mm) = 7500 F= Rapd traverse sped (mm/min) Fig.6.3 (b) Creating or changing the forbidden area using a pr
- Page 2166.SAFETY FUNCTIONS OPERATION B-63784EN-1/01 - Checkpoint for the forbidden area Confirm the checking position (the top of the tool or the tool chuck) before programming the forbidden area. If point A (The top of the tool) is checked in Fig. 6.3 (d) , the distance "a" should be set as the data for th
- Page 217B-63784EN-1/01 OPERATION 6.SAFETY FUNCTIONS - Effective time for a forbidden area Each limit becomes valid when reference position return has been performed manually or by G28 after power-up. After the power is turned on, if the reference position is in the forbidden area of each limit, an alarm is
- Page 2186.SAFETY FUNCTIONS OPERATION B-63784EN-1/01 Alarm Number Message Contents OT0001 + OVERTRAVEL ( SOFT 1 ) The tool entered the prohibited area of stored stroke check 1 during movement in the positive direction. OT0002 - OVERTRAVEL ( SOFT 1 ) The tool entered the prohibited area of stored stroke check
- Page 219B-63784EN-1/01 OPERATION 6.SAFETY FUNCTIONS 6.4 STROKE LIMIT CHECK PRIOR TO PERFORMING MOVEMENT During automatic operation, before the movement specified by a given block is started, whether the tool enters the inhibited area defined by stored stroke limit 1 or 2 is checked by determining the positi
- Page 2206.SAFETY FUNCTIONS OPERATION B-63784EN-1/01 Example 2) Inhibited area defined by End point stored stroke limit 2 a The tool is stopped at point a according Start point to stored stroke limit 2. Inhibited area defined by stored stroke limit 2 End point Start point Immediately upon movement commencing
- Page 221B-63784EN-1/01 OPERATION 6.SAFETY FUNCTIONS - Polar coordinate interpolation mode In polar coordinate interpolation mode, no check is made. - Three-dimensional coordinate conversion In three-dimensional coordinate conversion mode, no check is made. - PMC axis control No check is made for a movement
- Page 2227.ALARMS AND SELF DIAGNOSTC FUNCTIONS OPERATION B-63784EN-1/01 7 ALARMS AND SELF DIAGNOSTC FUNCTIONS Check the following items when operation is not normal : 1 When an error code is displayed on the operation screen If an error code is displayed, check the cause of the error according to Programming
- Page 223B-63784EN-1/01 OPERATION 7.ALARMS AND SELF DIAGNOSTC FUNCTIONS 7.1 CHECKING WITH THE DIAGNOSIS SCREEN The tool sometimes appears to stop when no alarm is indicated. In such a case, the system status can be checked using the self diagnosis screen. This screen can display a range of internal informati
- Page 2247.ALARMS AND SELF DIAGNOSTC FUNCTIONS OPERATION B-63784EN-1/01 Number selection Specify data to be displayed by using a number. Method 1 (1) Press the [NO. SEARCH] soft key. (2) Key in the number of the data you want to display. (3) Press the [EXEC] soft key. Method 2 (1) Press the [NO. SEARCH] soft
- Page 225B-63784EN-1/01 OPERATION 7.ALARMS AND SELF DIAGNOSTC FUNCTIONS With diagnosis numbers 1100 to 1111, you can check the TH alarm status. Table7.1 (c) TH Alarm Status Indication No. Indication Internal status when 1 is indicated 1100 POSITION(FOREGROUND) The position of a character that caused the TH a
- Page 2267.ALARMS AND SELF DIAGNOSTC FUNCTIONS OPERATION B-63784EN-1/01 7.2 INTERNAL POSITION COMPENSATION DATA DISPLAY FUNCTION The function for displaying internal position compensation data displays the data used in the CNC for each function while the following functions are executed: -Cutter compensation
- Page 227B-63784EN-1/01 OPERATION 7.ALARMS AND SELF DIAGNOSTC FUNCTIONS Cutter compensation Fig.7.2 (a) Cutter compensation MODE Displays ON in reverse video when the current mode is cutter compensation mode, and displays OFF in reverse video when the current mode is other than cutter compensation mode. OFFS
- Page 2287.ALARMS AND SELF DIAGNOSTC FUNCTIONS OPERATION B-63784EN-1/01 Tool length offset Fig.7.2 (b) Tool length offset MODE Displays ON in reverse video when the current mode is tool length compensation mode, and displays OFF in reverse video when the current mode is other than tool length compensation mo
- Page 229B-63784EN-1/01 OPERATION 7.ALARMS AND SELF DIAGNOSTC FUNCTIONS Canned cycle for drilling Fig.7.2 (c) Canned cycle for drilling MODE Displays ON in reverse video when the current mode is canned drilling cycle mode, and displays OFF in reverse video when the current mode is other than canned drilling
- Page 2307.ALARMS AND SELF DIAGNOSTC FUNCTIONS OPERATION B-63784EN-1/01 Coordinate System rotation Fig.7.2 (d) Coordinate System rotation MODE Displays ON in reverse video when the current mode is coordinate system rotation mode, and displays OFF in reverse video when the current mode is other than coordinat
- Page 231B-63784EN-1/01 OPERATION 7.ALARMS AND SELF DIAGNOSTC FUNCTIONS Three-dimensional coordinate conversion Fig.7.2 (e) Three-dimensional coordinate conversion MODE Displays ON in reverse video when the current mode is three- dimensional coordinate conversion mode, and displays OFF in reverse video when
- Page 2327.ALARMS AND SELF DIAGNOSTC FUNCTIONS OPERATION B-63784EN-1/01 Programmable mirror image Fig.7.2 (f) Programmable mirror image MODE Displays ON in reverse video when the current mode is programmable mirror image mode, and displays OFF in reverse video when the current mode is other than programmable
- Page 233B-63784EN-1/01 OPERATION 7.ALARMS AND SELF DIAGNOSTC FUNCTIONS Scaling Fig.7.2 (g) Scaling MODE Displays ON in reverse video when the current mode is scaling mode, and displays OFF in reverse video when the current mode is other than scaling mode. SCALING CENTER Displays the absolute position of the
- Page 2347.ALARMS AND SELF DIAGNOSTC FUNCTIONS OPERATION B-63784EN-1/01 Three- dimensional tool offset Fig.7.2 (h) Three- dimensional tool offset MODE Displays ON in reverse video when the current mode is three- dimensional tool offset mode, and displays OFF in reverse video when the current mode is other th
- Page 235B-63784EN-1/01 OPERATION 7.ALARMS AND SELF DIAGNOSTC FUNCTIONS Three dimensional cutter compensation Fig.7.2 (i) Three dimensional Cutter compensation MODE Three-dimensional cutter compensation has two modes: Tool side offset mode and leading edge offset mode. When the current mode is either of thes
- Page 2367.ALARMS AND SELF DIAGNOSTC FUNCTIONS OPERATION B-63784EN-1/01 7.3 COORDINATE SYSTEM RELATED DATA DISPLAY Offset data related to coordinate systems is displayed on the diagnosis screen described in Section II-7.1. Explanation The workpiece coordinate system used for automatic operation is defined wi
- Page 237B-63784EN-1/01 OPERATION 7.ALARMS AND SELF DIAGNOSTC FUNCTIONS 7.4 PERIODIC MAINTENANCE SCREEN The periodic maintenance screen provides a guideline indicating when consumables that require periodic replacement (such as the battery for control unit backup and the LCD unit backlight) are to be replace
- Page 2387.ALARMS AND SELF DIAGNOSTC FUNCTIONS OPERATION B-63784EN-1/01 ITEM NUMBER A sequence number from 01 to 10. ITEM NAME The name of an item subject to periodic maintenance is indicated. If the percentage (%) of the remaining service life is not greater than the percentage specified in parameter No. 22
- Page 239B-63784EN-1/01 OPERATION 7.ALARMS AND SELF DIAGNOSTC FUNCTIONS Item setting screen This screen is displayed by pressing the [SET ITEM] soft key on the status display screen. On the item setting screen, an item can be selected to set its periodic maintenance data such as the service life and count ty
- Page 2407.ALARMS AND SELF DIAGNOSTC FUNCTIONS OPERATION B-63784EN-1/01 Item selection menu screen This screen is displayed by pressing the [SET ITEM] soft key on the item setting screen. With the item selection menu screen, a list of items selected on the setting screen can be created. Fig.7.4 (c) Item Sele
- Page 241B-63784EN-1/01 OPERATION 7.ALARMS AND SELF DIAGNOSTC FUNCTIONS Setting periodic maintenance data Set periodic maintenance data on the item setting screen. Setting an item name - Setting by MDI key input 1) Position the cursor to a desired item name by using the cursor keys . 2) Key in an item name i
- Page 2427.ALARMS AND SELF DIAGNOSTC FUNCTIONS OPERATION B-63784EN-1/01 - Input format xxxxx xx* xxxxxxxx * xxxxxxxx Alphanumeric Kanji/hiragana Alphanumeric Describe alphanumeric characters directly. Kanji and hiragana character code must be enclosed by an asterisk (*). Either FANUC code or JIS code can be
- Page 243B-63784EN-1/01 OPERATION 7.ALARMS AND SELF DIAGNOSTC FUNCTIONS Setting the count type 1) Position the cursor to a desired count type by using the cursor keys . 2) Select a count type by pressing the [NO COUNT], [ALL TIME], [POWER ON], [AUTO START], or [CUTTING] soft key. Deleting an item 1) Press th
- Page 2447.ALARMS AND SELF DIAGNOSTC FUNCTIONS OPERATION B-63784EN-1/01 Setting item input/output The periodic maintenance data and machine menu can be input/output to and from external devices. Inputting setting items Method 1 (Neither the input file name nor number need be specified) (1) Select EDIT mode.
- Page 245B-63784EN-1/01 OPERATION 7.ALARMS AND SELF DIAGNOSTC FUNCTIONS Method 5 (The input file is specified with its file number (three of three methods)) (1) Select EDIT mode. (2) To input periodic maintenance data, display the item setting screen. To input the machine menu, display the item selection men
- Page 2467.ALARMS AND SELF DIAGNOSTC FUNCTIONS OPERATION B-63784EN-1/01 Method 4 (The output file is specified with its file number (two of three methods)) (1) Select EDIT mode. (2) To output periodic maintenance data, display the item setting screen. To output the machine menu, display the item selection me
- Page 247B-63784EN-1/01 OPERATION 7.ALARMS AND SELF DIAGNOSTC FUNCTIONS Input/output file format Periodic maintenance data G10 L60 P1 [n] Aa Rr Qq ; G10 L60 P2 [n] Aa Rr Qq ; G10 L60 P3 [n] Aa Rr Qq ; : : Item selection menu (machine) data G10 L61 P1 [n] ; G10 L61 P2 [n] ; G10 L61 P3 [n] ; : : G10 L60 : Spec
- Page 2487.ALARMS AND SELF DIAGNOSTC FUNCTIONS OPERATION B-63784EN-1/01 7.5 MAINTENANCE INFORMATION SCREEN The maintenance information screen allows service persons from FANUC and the machine tool builder to record a maintenance history of the machine. For details, refer to "FANUC Series 15i/150i-MODEL B Mai
- Page 249B-63784EN-1/01 OPERATION 8.EDITING PROGRAMS 8 EDITING PROGRAMS This section describes the operations for editing programs registered with the CNC. Editing operations include the insertion, alteration, deletion, and replacement of words/blocks; cancellation of the effects of editing; cutting and past
- Page 2508.EDITING PROGRAMS OPERATION B-63784EN-1/01 8.1 INPUTTING AND OUTPUTTING PROGRAMS This section explains the operations for inputting programs from and outputting programs to external input/output units, as well as the related functions. 8.1.1 Inputting Programs Programs can be registered from extern
- Page 251B-63784EN-1/01 OPERATION 8.EDITING PROGRAMS Method 4 (The input file is specified with its file number (one of two methods)) (1) Select EDIT mode. (2) Follow the procedure described in Section II-10.1, "Programs" to display the program text screen. (3) Press the [READ] soft key. (4) Press N the addr
- Page 2528.EDITING PROGRAMS OPERATION B-63784EN-1/01 Registering a program with a new program number A program can be registered with a new keyed-in program number. Procedure - Methods in which neither the input file name nor number need be specified Method 1 (1) Select EDIT mode. (2) Follow the procedure de
- Page 253B-63784EN-1/01 OPERATION 8.EDITING PROGRAMS Method 2 (1) Select EDIT mode. (2) Follow the procedure described in Section II-10.1, "Programs" to display the program text screen. (3) Press the [READ] soft key. (4) Press the ["FILE NAME] soft key. (5) Enter a file name. (6) Press the [FILE NAME"] soft
- Page 2548.EDITING PROGRAMS OPERATION B-63784EN-1/01 Registering multiple NC programs Procedure Method 1 (Neither the input file names nor numbers need be specified) (1) Select EDIT mode. (2) Follow the procedure described in Section II-10.1, "Programs" to display the program text screen. (3) Press the [READ
- Page 255B-63784EN-1/01 OPERATION 8.EDITING PROGRAMS Registering additional programs A program can be loaded and merged with the program selected on the CNC. Procedure Method 1 (Neither the input file name nor number need be specified) (1) Select EDIT mode. (2) Follow the procedure described in Section II-10
- Page 2568.EDITING PROGRAMS OPERATION B-63784EN-1/01 Stopping registration While a program is being loaded, pressing the [STOP] soft key causes loading of the program to stop. Once stopped, loading cannot be resumed. Explanation - Program end codes in files and program numbers Usually, M02, M30, and M99 are
- Page 257B-63784EN-1/01 OPERATION 8.EDITING PROGRAMS Warning Message Description ALREADY EXISTS An attempt was made to register a program with the same program number as that of a previously registered program in program memory. WRITE PROTECT An attempt was made to register a program that is write- protected
- Page 2588.EDITING PROGRAMS OPERATION B-63784EN-1/01 8.1.2 Outputting Programs Programs can be output to external input/output units. Outputting the currently displayed program Procedure Method 1 (Neither the output file name nor number need be specified) (1) Select EDIT mode. (2) Follow the procedure descri
- Page 259B-63784EN-1/01 OPERATION 8.EDITING PROGRAMS Outputting a specified single program Procedure - Neither the input file name nor number need be specified Method 1 (1) Select EDIT mode. (2) Follow the procedure described in Section II-10.1, "Programs" to display the program text screen. (3) Press the [P
- Page 2608.EDITING PROGRAMS OPERATION B-63784EN-1/01 Method 2 (1) Select EDIT mode. (2) Follow the procedure described in Section II-10.1, "Programs" to display the program text screen. (3) Press the [PUNCH] soft key. (4) Press the ["FILE NAME] soft key. (5) Enter a file name. (6) Press the [FILE NAME"] soft
- Page 261B-63784EN-1/01 OPERATION 8.EDITING PROGRAMS Outputting specified multiple programs A specified range of programs can be output. Procedure - Neither the output file name nor number need be specified Method 1 (1) Select EDIT mode. (2) Follow the procedure described in Section II-10.1, "Programs" to di
- Page 2628.EDITING PROGRAMS OPERATION B-63784EN-1/01 - The output file is specified with its file name Method 1 (1) Select EDIT mode. (2) Follow the procedure described in Section II-10.1, "Programs" to display the program text screen. (3) Press the [PUNCH] soft key. (4) Press the ["FILE NAME] soft key. (5)
- Page 263B-63784EN-1/01 OPERATION 8.EDITING PROGRAMS - Specified with its file number Method 1 (1) Select EDIT mode. (2) Follow the procedure described in Section II-10.1, "Programs" to display the program text screen. (3) Press the [PUNCH] soft key. (4) Press the [(FILE#)] soft key. (5) Enter a file number.
- Page 2648.EDITING PROGRAMS OPERATION B-63784EN-1/01 Outputting all programs Procedure Method 1 (Neither the output file name nor number need be specified) (1) Select EDIT mode. (2) Follow the procedure described in Section II-10.1, "Programs" to display the program text screen. (3) Press the [PUNCH] soft ke
- Page 265B-63784EN-1/01 OPERATION 8.EDITING PROGRAMS Outputting a portion of the currently displayed program That portion of the currently displayed program that starts from the current cursor position can be output. Procedure Method 1 (Neither the output file name nor number need be specified) (1) Select ED
- Page 2668.EDITING PROGRAMS OPERATION B-63784EN-1/01 Pausing/stopping the output and canceling the feed Pausing the output While a program is being output, pressing the [PAUSE] soft key causes output of the program to pause. Subsequently, the output can be resumed, or the program can be output one block at a
- Page 267B-63784EN-1/01 OPERATION 8.EDITING PROGRAMS 8.1.3 Collating Programs Programs entered from external input/output units can be collated with programs in program memory. Collating a single program Procedure Method 1 (Neither the file name nor number need be specified) (1) Select EDIT mode. (2) Follow
- Page 2688.EDITING PROGRAMS OPERATION B-63784EN-1/01 Explanation A program loaded from an external input/output unit can be collated with a program retrieved from program memory. If no mismatches are found, the collated program is displayed and collation ends. If a mismatch is found, alarm PS400 PROGRAM NOT
- Page 269B-63784EN-1/01 OPERATION 8.EDITING PROGRAMS Explanation Multiple programs can be loaded from an external input/output unit one after another and collated with programs retrieved from program memory, one program at a time. If no mismatches are found, the program collated last is displayed and collati
- Page 2708.EDITING PROGRAMS OPERATION B-63784EN-1/01 8.1.4 Keys and Program Encryption Programs can be secured by setting a password and a program security range with the appropriate parameters. 1 Security with a password and a security range When the password and security range parameters are specified, the
- Page 271B-63784EN-1/01 OPERATION 8.EDITING PROGRAMS NOTE 1 For security, the values set for PSW and KEY are not displayed. For the same reason, PSW, PMIN, and PMAX can be specified only when no password is set or the program memory is unlocked. Set a password, taking great care to avoid a situation where th
- Page 2728.EDITING PROGRAMS OPERATION B-63784EN-1/01 - Outputting specified multiple programs Locked/unlocked Results Locked Those programs that fall outside the protected range are output as usual. For those programs that fall within the protected range, SR0581 alarm "ENCODE ALARM (PARAMETER)" is output. Un
- Page 273B-63784EN-1/01 OPERATION 8.EDITING PROGRAMS NOTE 1 To encrypt programs, set parameter EIA (bit 4 of No. 0000) to 0 (to specify that the punch code is ISO). 2 An encrypted program cannot be registered as an additional program ([READ]-[1_PROGRAM]-[ADD]). 3 Programs outside the security range cannot be
- Page 2748.EDITING PROGRAMS OPERATION B-63784EN-1/01 Warning Message Description WRITE An attempt was made to edit or delete a program within PROTECTION the security range when the program memory was locked. INVISIBLE An attempt was made to select or output a program within PROGRAM the security range when th
- Page 275B-63784EN-1/01 OPERATION 8.EDITING PROGRAMS 8.1.5 Stored Program Lengths and Number of Registerable Programs The following stored program lengths are available: 80m, 160m, 320m, 640m, 1280m, 2560m, or 5120m The number of registerable NC programs is as follows: Stored program length ( m ) 80 160 320
- Page 2768.EDITING PROGRAMS OPERATION B-63784EN-1/01 8.2 CURSOR Editing operations such insertion, alteration, and deletion are performed on the character string to which the cursor is positioned. Basically, the cursor is displayed on a word such as a program number, G code command, or address command. Custo
- Page 277B-63784EN-1/01 OPERATION 8.EDITING PROGRAMS 8.2.2 Positioning the Cursor Registering a single program 1 Use the cursor key to position the cursor forward by one word. When the key is pressed and held down, the cursor moves repeatedly. 2 Use the cursor key to position the cursor back by one word. Whe
- Page 2788.EDITING PROGRAMS OPERATION B-63784EN-1/01 8.3 PROGRAM NUMBER SEARCH A program can be selected from among those in program memory. Searching for the immediately preceding (succeeding) program Procedure Method 1 (1) Select EDIT or MEM mode. (2) Follow the procedure described in Section II-10.1, "Pro
- Page 279B-63784EN-1/01 OPERATION 8.EDITING PROGRAMS Searching for a program by specifying a program number Procedure Method 1 (1) Select EDIT or MEM mode. (2) Follow the procedure described in Section II-10.1, "Programs" to display the program text screen. (3) Press the [FRWRD SEARCH] ([BKWRD SEARCH]) soft
- Page 2808.EDITING PROGRAMS OPERATION B-63784EN-1/01 8.4 WORD SEARCH/ADDRESS SEARCH It is possible to search for a specified word, address, or character string through an NC program and position the cursor to it. 8.4.1 Word Search Word search Procedure Method 1 (1) Press the [FRWRD SEARCH] ([BKWRD SEARCH]) s
- Page 281B-63784EN-1/01 OPERATION 8.EDITING PROGRAMS Limitation 1 Even when an attempt is made to search for a portion of a word, such as a function name or variable, the cursor is positioned to the entire word. 2 The / and /n in an optional block skip are not distinguished from those in a macro statement. 3
- Page 2828.EDITING PROGRAMS OPERATION B-63784EN-1/01 8.4.2 Address Search Address search Procedure Method 1 (1) Press the [FRWRD SEARCH] ([BKWRD SEARCH]) soft key. (2) Enter the address to search for. (3) Press the [EXEC] soft key. Method 2 (1) Enter the address to search for. (2) Press the [FRWRD SEARCH] ([
- Page 283B-63784EN-1/01 OPERATION 8.EDITING PROGRAMS 8.4.3 Search Repeat Function Once a word/address search has been performed, the search can be repeated under the same conditions with a simple operation. Search repeat function Procedure (1) Perform a word or address search. (2) Press the [FRWRD SEARCH] ([
- Page 2848.EDITING PROGRAMS OPERATION B-63784EN-1/01 8.5 INSERTING WORDS AND BLOCKS Words and blocks can be inserted at the cursor position. Inserting a word or block Procedure (1) Position the cursor to the point where you want to insert a word or block. (2) Key in the word you want to insert. Multiple word
- Page 285B-63784EN-1/01 OPERATION 8.EDITING PROGRAMS 8.6 CHANGING WORDS AND BLOCKS 1 The word at the cursor position can be overwritten with an entered word or block. 2 A word, address, or character string in the program being edited can be replaced. 8.6.1 Overwriting Words Overwriting words Procedure (1) Po
- Page 2868.EDITING PROGRAMS OPERATION B-63784EN-1/01 8.6.2 Replacing Words and Character Strings Confirming each replacement Procedure Method 1 (1) Press the [ALTER] soft key. (2) Key in the word or character string to be replaced. A list of multiple words can also be keyed in. (3) Press the [(WORD)] soft ke
- Page 287B-63784EN-1/01 OPERATION 8.EDITING PROGRAMS Method 3 (1) Key in the word or character string to be replaced, followed by a new word or character string, as shown in the example. Multiple words to be replaced and multiple new words can be entered. Example: To replace G90 with G91, enter G90,G91. (2)
- Page 2888.EDITING PROGRAMS OPERATION B-63784EN-1/01 Replacing all the occurrences of a character string without confirming each occurrence Procedure Method 1 (1) Press the [ALTER] soft key. (2) Key in the word or character string to be replaced. A list of words can also be keyed in. (3) Press the [(WORD)] s
- Page 289B-63784EN-1/01 OPERATION 8.EDITING PROGRAMS Character string that can be replaced 1 NC commands Examples: G00, X100., M99 2 Macro statements Examples: #100 = #102+1, IF[#300EQ0]GOTO100 3 Function names and variables Examples: SIN in #1=SIN[#2], #102 in #100= #102+1 4 Portions of expressions Examples
- Page 2908.EDITING PROGRAMS OPERATION B-63784EN-1/01 8.6.3 Replacing Addresses Confirming each replacement Procedure Method 1 (1) Press the [ALTER] soft key. (2) Key in the address to be replaced. (3) Press the [(Address)] soft key. (4) Key in a new address. (5) Press the [EXEC SINGLE] soft key. The system s
- Page 291B-63784EN-1/01 OPERATION 8.EDITING PROGRAMS Replacing all the occurrences of an address without confirmation Procedure Method 1 (1) Press the [ALTER] soft key. (2) Key in the address to be replaced. (3) Press the [(ADDRESS)] soft key. (4) Key in a new address. (5) Press the [EXEC] soft key. The syst
- Page 2928.EDITING PROGRAMS OPERATION B-63784EN-1/01 8.7 DELETING WORDS AND BLOCKS The word at the cursor position can be deleted, as well as selected multiple words and blocks. Deleting a single word Procedure (1) Position the cursor to the word to be deleted. (2) Press DELETE the key. Deleting multiple wor
- Page 293B-63784EN-1/01 OPERATION 8.EDITING PROGRAMS 8.8 CUTTING AND PASTING The following four basic operations can be combined to copy and move words and blocks. 1 Move a specified range to the copy buffer. (Cutting) 2 Copy a specified range to the copy buffer. (Copying) 3 Insert the contents of the copy b
- Page 2948.EDITING PROGRAMS OPERATION B-63784EN-1/01 Pasting Procedure Method 1 (1) Position the cursor to the position at which the contents of the copy buffer are to be inserted. (2) Press the [PASTE] soft key. (3) Press the [HERE] soft key. The contents of the copy buffer are inserted ahead of the cursor.
- Page 295B-63784EN-1/01 OPERATION 8.EDITING PROGRAMS Pasting a program Procedure Method 1 (1) Press the [PASTE] soft key. (2) Press the [(PROG)#] soft key. (3) Enter a program number. (4) Press the [EXEC] soft key. A program is created with the contents of the copy buffer. Method 2 (1) Press the [PASTE] soft
- Page 2968.EDITING PROGRAMS OPERATION B-63784EN-1/01 Warning Message Description NO MORE SPACE An attempt was made to cut or copy words or blocks exceeding the capacity of the copy buffer. - 274 -
- Page 297B-63784EN-1/01 OPERATION 8.EDITING PROGRAMS 8.8.2 Copying, Moving, and Deleting Words and Blocks Copying a word or block Procedure (1) Copy the word or block to be copied. (2) Select the program to which it is to be copied. (3) Position the cursor to the desired point. (4) Paste the word or block. M
- Page 2988.EDITING PROGRAMS OPERATION B-63784EN-1/01 8.9 CANCELING THE EFFECTS OF EDITING WORDS AND BLOCKS The effects of accidentally deleting and inserting words and blocks can be canceled. This is called undoing. Explanation While a program is being edited in EDIT/MDI mode, the immediately preceding editi
- Page 299B-63784EN-1/01 OPERATION 8.EDITING PROGRAMS Undoing Procedure (1) Select the program you want to restore to its previous state by undoing. (2) Place the program in the same editing status as that when the editing operation was performed. Example: To restore the program that was edited in the right p
- Page 3008.EDITING PROGRAMS OPERATION B-63784EN-1/01 8.10 COPYING PROGRAMS The entire contents of a single program can be copied to create a new one. Copying a program Procedure Method 1 (1) Select the program to be copied. (2) Press the [COPY PRGRAM] soft key. (3) Press the [(PROG)#] soft key. (4) Key in th
- Page 301B-63784EN-1/01 OPERATION 8.EDITING PROGRAMS 8.11 MERGING PROGRAMS The program being edited can be merged with any program. Merging programs Procedure Method 1 (1) Select the first program. (2) Press the [MERGE PRGRAM] soft key. (3) Press the [(PROG)#] soft key. (4) Key in the program number of the p
- Page 3028.EDITING PROGRAMS OPERATION B-63784EN-1/01 8.12 DELETING PROGRAMS Any program can be deleted. Deleting a single program Procedure Method 1 (1) Press the [DELETE PRGRAM] soft key. (2) Press the [(PROG)#] soft key. (3) Key in the program number of the program you want to delete. (4) Press the [EXEC]
- Page 303B-63784EN-1/01 OPERATION 8.EDITING PROGRAMS Deleting multiple programs Multiple programs can be deleted by specifying a range of program numbers. Procedure Method 1 (1) Press the [DELETE PRGRAM] soft key. (2) Press the [(PROG)#] soft key. (3) Key in the number of the first program you want to delete
- Page 3048.EDITING PROGRAMS OPERATION B-63784EN-1/01 8.13 RESTORING A DELETED PROGRAM A program deleted accidentally can be restored. This is called undeleting. Explanation A single program deleted accidentally can be restored. Restoration is not possible if: 1 Multiple or all programs are deleted. 2 A singl
- Page 305B-63784EN-1/01 OPERATION 8.EDITING PROGRAMS 8.14 BACKGROUND EDITING The editing of a program while another program is being executed or edited is called background editing. Background editing allows searching, editing, registration, and deletion of programs in the same way as in ordinary editing (fo
- Page 3068.EDITING PROGRAMS OPERATION B-63784EN-1/01 Ending background editing Procedure Press the [BACKGROUND EDIT END] soft key. Limitation 1 When an attempt is made to background edit the program that is currently in the foreground, a warning "PROGRAM IN OPERATION" may be issued. 2 When an attempt is made
- Page 307B-63784EN-1/01 OPERATION 8.EDITING PROGRAMS 8.15 EDITING TWO PROGRAMS SIMULTANEOUSLY The program text screen can be divided into right and left portions, so that two programs can be edited simultaneously. Display Fig.8.15 Editing Two Programs Simultaneously The program text screen can be divided int
- Page 3088.EDITING PROGRAMS OPERATION B-63784EN-1/01 Method 3 (1) Press the O address key. (2) Enter a program number. (3) Press the [MULTI EDIT] soft key. Method 4 (1) Press the [MULTI EDIT] soft key. (2) Press the [PRVIOS PRGRAM] soft key. The program that was last edited in the right portion is selected.
- Page 309B-63784EN-1/01 OPERATION 8.EDITING PROGRAMS 8.16 EDITING PROGRAMS IN OPERATION During automatic operation, programs can be edited by stopping automatic operation with the feed hold or single block function. Automatic operation can then be resumed. Editing programs in operation Procedure (1) Stop aut
- Page 3108.EDITING PROGRAMS OPERATION B-63784EN-1/01 8.17 CONDENSING THE PROGRAM MEMORY In program memory, NC programs are first registered in contiguous areas. When an NC program is edited, however, it is divided into several blocks. The more frequently it is edited, the more it is fragmented. When an NC pr
- Page 311B-63784EN-1/01 OPERATION 8.EDITING PROGRAMS Method 3 (1) Select EDIT mode. (2) Follow the procedure described in Section II-10.1, "Programs" to display the program text screen. (3) Press O the address key. (4) Enter the number of the program for which the program memory is to be condensed. (5) Press
- Page 3128.EDITING PROGRAMS OPERATION B-63784EN-1/01 8.18 CREATING PROGRAMS USING THE MDI PANEL Using the functions described in this chapter programs can be created in EDIT mode. Creating a program using the MDI panel Procedure (1) Select EDIT mode. (2) Follow the procedure described in Section II-10.1, "Pr
- Page 313B-63784EN-1/01 OPERATION 8.EDITING PROGRAMS 8.19 PLAYBACK Playback is a function in which teach in mode is selected, so that the machine can be moved along an axis to the desired machine position, and the position is inserted into the machining program. Explanations Teach in mode is that mode in whi
- Page 3148.EDITING PROGRAMS OPERATION B-63784EN-1/01 Creating a program in THCH IN mode Procedure (1) Follow the procedure described in Section II-10.1, "Programs" to display the program text screen. (2) Select teach in mode. When the system enters teach in mode, the program text screen changes to the dedica
- Page 315B-63784EN-1/01 OPERATION 8.EDITING PROGRAMS Example O1234; N1 G90 G00 X10. Y0 Z10.; Z N2 G00 X3.025 Y23.723; N3 G01 Z-0.325 F300.; N4 M02; P1(3.025, 23.723, 10.0) P0 (10.0, 0.0, 10.0) Y X P2(3.025, 23.723, -0.325) Fig.8.19 (b) Sample Program (1) Select teach in manual handle mode. (2) Display the pr
- Page 3168.EDITING PROGRAMS OPERATION B-63784EN-1/01 Registering machine positions with compensation When, in teach in mode, an axis address is keyed in, followed by a numeric value, the keyed-in numeric value is added to the absolute coordinate position before the position is registered. This is useful for
- Page 317B-63784EN-1/01 OPERATION 8.EDITING PROGRAMS 8.20 AUTOMATICALLY INSERTING SEQUENCE NUMBERS During programming, the sequence number of the next block can be automatically inserted each time ;(EOB) is inserted. The initial sequence number and the increment must be set for the appropriate parameters. Au
- Page 3188.EDITING PROGRAMS OPERATION B-63784EN-1/01 8.21 STAMPING THE MACHINING TIME When a program is executed during memory operation, the time required for the main program is measured and displayed, and the result is stamped (inserted) on the program as a comment section. Displaying the machining time T
- Page 319B-63784EN-1/01 OPERATION 8.EDITING PROGRAMS - Program directory screen Fig.8.21 (b) Program Directory Screen Follow the procedure described in Section II-10.1, "Programs" to display the program directory screen. On the program name list on this screen, stamped machining times are displayed instead o
- Page 3208.EDITING PROGRAMS OPERATION B-63784EN-1/01 Measuring the machining time 1 The time from the start of a program until a reset, M02, or M30 is measured as the machining time. 2 If, during measurement, an alarm occurs, causing the program to stop, the time until a reset is measured. 3 If the program i
- Page 321B-63784EN-1/01 OPERATION 9.SETTING AND DISPLAYING DATA 9 SETTING AND DISPLAYING DATA - 299 -
- Page 3229.SETTING AND DISPLAYING DATA OPERATION B-63784EN-1/01 9.1 DISPLAYING AND SETTING TOOL OFFSET VALUES Tool offset values, tool length compensation values, and cutter compensation values are specified by D codes (cutter compensation) or H codes (tool length compensation). The compensation values corre
- Page 323B-63784EN-1/01 OPERATION 9.SETTING AND DISPLAYING DATA - Tool offset memory B Distinction is made between geometry and wear, but no distinction is made between D codes and H codes. Fig. 9.1 (b) Tool Offset Memory B - Tool offset memory C A distinction is made between D codes (radius) and H codes (le
- Page 3249.SETTING AND DISPLAYING DATA OPERATION B-63784EN-1/01 Setting/updating tool offsets -Moving the cursor Method 1 PAGE Using the page keys PAGE and the cursor keys , position the cursor to the offset to be set/updated. Method 2 (1) Press the [NUMBER SEARCH] soft key. (2) Key in the number of the offs
- Page 325B-63784EN-1/01 OPERATION 9.SETTING AND DISPLAYING DATA - Offset increment system As an offset, a number with or without a decimal point can be entered. The increment system of an offset depends on the setting of the parameters, as indicated below. Offset increment system Parameter (valid data range)
- Page 3269.SETTING AND DISPLAYING DATA OPERATION B-63784EN-1/01 Tool offset input/output - Tool offset input Method 1 (Neither the input file name nor number need be specified) (1) Select MDI mode. (2) Press the [READ] soft key. (3) Press the [TOOL OFFSET] soft key. Method 2 (The input file is specified with
- Page 327B-63784EN-1/01 OPERATION 9.SETTING AND DISPLAYING DATA Method 2 (The output file is specified with its file name) (1) Press the [PUNCH] soft key. (2) Press the ["FILE NAME] soft key. (3) Enter a file name. (4) Press the [FILE NAME"] soft key. (5) Press the [TOOL OFFSET] soft key. Method 3 (The outpu
- Page 3289.SETTING AND DISPLAYING DATA OPERATION B-63784EN-1/01 Measurement The [MEASURE] soft key is used for tool length measurement. For details of this function, see Section II-9.10, "Tool Length Measurement." - 306 -
- Page 329B-63784EN-1/01 OPERATION 9.SETTING AND DISPLAYING DATA 9.2 DISPLAYING AND SETTING WORKPIECE ORIGIN OFFSETS The workpiece origin offset for each workpiece coordinate system (G54 to G59 and G54.1 P1 to G54.1 P48) and an external workpiece origin offset are displayed and set. Displaying the workpiece o
- Page 3309.SETTING AND DISPLAYING DATA OPERATION B-63784EN-1/01 PAGE 3 The page keys PAGE enables paging. Each time paging is performed, the cursor moves to the top of a page. - Searching for a workpiece coordinate system A workpiece coordinate system can be found using a number indicated in the table below.
- Page 331B-63784EN-1/01 OPERATION 9.SETTING AND DISPLAYING DATA Workpiece origin offset input/output - Workpiece origin offset input Method 1 (Neither the input file name nor number need be specified) (1) Press the [READ] soft key. (2) Press the [WORK OFFSET] soft key. Method 2 (The input file is specified w
- Page 3329.SETTING AND DISPLAYING DATA OPERATION B-63784EN-1/01 Method 3 (The input file is specified with its file number (one of three methods)) (1) Press the [PUNCH] soft key. (2) Press the [(FILE #)] soft key. (3) Enter a file number. (4) Press the [WORK OFFSET] soft key. Method 4 (The input file is spec
- Page 333B-63784EN-1/01 OPERATION 9.SETTING AND DISPLAYING DATA 9.3 DISPLAY AND SETTING OF SETTING PARAMETERS Parameters that can be set by input (setting parameters) can be displayed and set on the setting parameter screen. Displaying setting parameters To display the setting parameter screen, follow the pr
- Page 3349.SETTING AND DISPLAYING DATA OPERATION B-63784EN-1/01 1. Bit type parameters This type of parameter consists of 8 bits, each of which is set to 0 or 1. A bit name is displayed above each bit position. (No name is displayed above some bit positions.) Setting Parameter number Bit name 2. Integer type
- Page 335B-63784EN-1/01 OPERATION 9.SETTING AND DISPLAYING DATA 4. Parameters of bit axis type Controlled axis name 5. Parameters of integer axis type 6. Parameters of real number axis type - 313 -
- Page 3369.SETTING AND DISPLAYING DATA OPERATION B-63784EN-1/01 Setting of setting parameters - Mode setting Select MDI mode, or enter the emergency stop state by pressing the emergency stop button. - Data protection key Turn on the data protection key (KEY2). - Positioning the cursor Position the cursor to
- Page 337B-63784EN-1/01 OPERATION 9.SETTING AND DISPLAYING DATA Method 2 (1) Key in an incremental or decremental value relative to the current setting. (2) Press the [+INPUT] soft key. NOTE For parameters of bit type and bit axis type, incremental input is impossible. Pressing the [+INPUT] soft key sets abs
- Page 3389.SETTING AND DISPLAYING DATA OPERATION B-63784EN-1/01 Selecting a group On the group selection screen, the setting parameters of a desired group can be easily displayed. - Group selection screen Fig. 9.3 (b) Group Selection Screen - Displaying the group selection screen On the setting parameter scr
- Page 339B-63784EN-1/01 OPERATION 9.SETTING AND DISPLAYING DATA 9.4 DISPLAYING AND SETTING CUSTOM MACRO VARIABLE VALUES The values of the local variables (#1 to #33), common variables (#100 to #199, #200 to #499, #500 to #999), and system variables (#1000 and up) are displayed. Values can be set in the commo
- Page 3409.SETTING AND DISPLAYING DATA OPERATION B-63784EN-1/01 - Custom macro screen (#500 to #549, and system variables) The numbers, names, and values of the custom macro variables are displayed. Fig. 9.4 (b) Custom Macro Screen with Variable Names - Undisplayable variable values For undisplayable variabl
- Page 341B-63784EN-1/01 OPERATION 9.SETTING AND DISPLAYING DATA - Positioning the cursor Position the cursor to the custom macro variable you want to set. Method 1 Using the page keys PAGE PAGE and the cursor keys , position the cursor. Method 2 (1) Press the [NUMBER SEARCH] soft key. (2) Key in the number o
- Page 3429.SETTING AND DISPLAYING DATA OPERATION B-63784EN-1/01 - Clearing common variable 1/2 to 0 Common variable 1 and common variable 2 can be cleared to 0 at the same time. When clearing both common variable 1 and common variable 2 to 0 (1) Press the [ALL CLEAR] soft key. The soft key display changes to
- Page 343B-63784EN-1/01 OPERATION 9.SETTING AND DISPLAYING DATA 9.5 INPUT/OUTPUT OPERATION OF CUSTOM MACRO COMMON VARIABLES The value of a custom macro common variable (#200 to #999) can be output to an external input/output device. A value can be set in a custom macro common variable (#200 to #999) from an
- Page 3449.SETTING AND DISPLAYING DATA OPERATION B-63784EN-1/01 Method 5 (The input file is specified with its file number (three of three methods)) (1) Press the N address key. (2) Enter a file number. (3) Press the [PUNCH] soft key. -Output format The value of a custom macro common variable is output as do
- Page 345B-63784EN-1/01 OPERATION 9.SETTING AND DISPLAYING DATA Input operation of custom macro common variables Custom macro common variables can be entered from an external input/output device. - Mode setting Set MDI mode. - Input procedure Method 1 (Neither the input file name nor number need be specified
- Page 3469.SETTING AND DISPLAYING DATA OPERATION B-63784EN-1/01 - Procedure for inputting from a file of custom macro statement program format Custom macro common variables can be entered from a file of conventional custom macro statement program format. (1) Enter the file as described in Section II-12.3.2,
- Page 347B-63784EN-1/01 OPERATION 9.SETTING AND DISPLAYING DATA 9.6 DISPLAYING AND SETTING PARAMETERS When the CNC is connected to a machine, the parameters are set to determine the machine specifications and functions and to make full use of the capability of the servo motor and so forth. The parameter sett
- Page 3489.SETTING AND DISPLAYING DATA OPERATION B-63784EN-1/01 - Types of parameters According to the types of settings, parameters are divided into three types: bit type, integer type, and real number type. 1. Bit type parameters This type of parameter consists of 8 bits, each of which is set to 0 or 1. A
- Page 349B-63784EN-1/01 OPERATION 9.SETTING AND DISPLAYING DATA 4. Bit axis type parameters Controlled axis name 5. Integer axis type parameters 6. Real number axis type parameters Parameters of spindle type are available which set a value for each spindle. According to the types of settings, parameters of s
- Page 3509.SETTING AND DISPLAYING DATA OPERATION B-63784EN-1/01 7. Bit spindle type parameters Spindle name 8. Integer spindle type parameters 9. Real number spindle type parameters - 328 -
- Page 351B-63784EN-1/01 OPERATION 9.SETTING AND DISPLAYING DATA Setting parameters - Mode setting Select MDI mode, or enter the emergency stop state by pressing the emergency stop button. - Setting parameter PWE On the setting parameter screen, set bit 0 (PWE) of parameter No. 8000 for allowing setting input
- Page 3529.SETTING AND DISPLAYING DATA OPERATION B-63784EN-1/01 - Entering settings (incremental input) Method 1 (1) Press the [+INPUT] soft key. (2) Key in an incremental or decremental value relative to the current setting. (3) Press the [EXEC] soft key. Method 2 (1) Key in an incremental or decremental va
- Page 353B-63784EN-1/01 OPERATION 9.SETTING AND DISPLAYING DATA Selecting a group On the group selection screen, the parameters of a desired group can easily be displayed. - Group selection screen Fig. 9.6 (b) Group Selection Screen - Displaying the group selection screen On the parameter screen, press the [
- Page 3549.SETTING AND DISPLAYING DATA OPERATION B-63784EN-1/01 9.7 DISPLAYING AND SETTING PITCH ERROR COMPENSATION DATA Pitch error compensation data is set to match the characteristics of a machine connected to the CNC. Pitch error compensation data varies from one machine to another, and any modification
- Page 355B-63784EN-1/01 OPERATION 9.SETTING AND DISPLAYING DATA 9.8 MANUAL TOOL LENGTH MEASUREMENT A numeric value displayed as a relative position can be placed in offset memory as an offset by using the soft keys. To do this, first choose the tool offset screen. This screen shows a relative position. Then,
- Page 3569.SETTING AND DISPLAYING DATA OPERATION B-63784EN-1/01 Tool length measurement - Selecting the offset to be changed Procedure 1 Position the cursor to the offset to be changed or set by pressing a PAGE page key PAGE or a cursor key . Procedure 2 (1) Press the [NO. SEARCH] soft key. (2) Enter a numbe
- Page 357B-63784EN-1/01 OPERATION 9.SETTING AND DISPLAYING DATA - Measuring the tool length First, choose and manually move a reference tool until it touches the machine-specific point. Then, press the [MEASURE] soft key -> [ORIGIN] soft key to zero the counter (relative position display). Next, choose the t
- Page 3589.SETTING AND DISPLAYING DATA OPERATION B-63784EN-1/01 When the function of tool offset by tool number is provided If the function of tool offset by tool number is supported, manual tool length measurement can be performed in the same way. To display the screen for setting tool offset by tool number
- Page 359B-63784EN-1/01 OPERATION 9.SETTING AND DISPLAYING DATA 9.9 MANUAL WORKPIECE ORIGIN SETTING On the workpiece origin offset screen, a workpiece origin offset can be set so that the current machine position is the origin of a selected workpiece coordinate system or a specified position. Displaying the
- Page 3609.SETTING AND DISPLAYING DATA OPERATION B-63784EN-1/01 Selecting a workpiece coordinate system and axis Selecting a workpiece coordinate system Select the workpiece coordinate system you want to set. A workpiece coordinate system can be found using a number indicated in the table below. No. Found wo
- Page 361B-63784EN-1/01 OPERATION 9.SETTING AND DISPLAYING DATA Operation example 1. When a common workpiece origin offset value and workpiece coordinate system No. 1 (G54) are set (1) When an operation is performed so that the current position (machine coordinates: X100.000,Y200.000) is the origin of workpi
- Page 3629.SETTING AND DISPLAYING DATA OPERATION B-63784EN-1/01 (2) When an operation is performed so that the current position (machine coordinates: X100.000,Y200.000) is (X-50.000,Y-50.000) in workpiece coordinate system No. 1 Y 300 A: Common workpiece origin offset B: Original G54 workpiece origin offset
- Page 363B-63784EN-1/01 OPERATION 9.SETTING AND DISPLAYING DATA Operation example 2. When a local coordinate system (G52) is set When an operation is performed so that the current position (machine coordinates: X50.000, Y150.000) is the origin of workpiece coordinate system No. 1 (provided that the common wo
- Page 3649.SETTING AND DISPLAYING DATA OPERATION B-63784EN-1/01 Operation example 3. When tool length compensation and cutter compensation are enabled When an operation is performed so that the current position (machine coordinates: X100.000, Z200.000) is the origin of workpiece coordinate system No. 1 (prov
- Page 365B-63784EN-1/01 OPERATION 9.SETTING AND DISPLAYING DATA 9.10 TOOL LENGTH/WORKPIECE ORIGIN MEASUREMENT The length of a tool can be measured by executing a program command for automatic tool length measurement (G37) (Section II-16.5, "Automatic Tool Length Measurement" in Programming) or by manually mo
- Page 3669.SETTING AND DISPLAYING DATA OPERATION B-63784EN-1/01 Procedure for measuring a tool length offset A tool length offset can be measured by manually bringing the tool into contact with a workpiece or a reference block. For details of the actual operation, refer to the manual supplied by the machine
- Page 367B-63784EN-1/01 OPERATION 9.SETTING AND DISPLAYING DATA Fig. 9.10 (b) Tool Length Offset Measurement Screen (Offset Memory B) Fig. 9.10 (c) Tool Length Offset Measurement Screen (Offset Memory C) NOTE The values of addresses T and M can be reset to 0. In the MEM or MDI mode, the values of the modal T
- Page 3689.SETTING AND DISPLAYING DATA OPERATION B-63784EN-1/01 5 Select the desired tool. While status indication OFST is blinking on the tool length offset measurement screen, a T code and M code can be programmed in manual handle feed or jog feed mode (manual numeric command). Key in Ttttt, and then press
- Page 369B-63784EN-1/01 OPERATION 9.SETTING AND DISPLAYING DATA Description - Definition of the tool length offset The tool length offset can generally be defined in two methods, as described below. The two methods share a single view that a tool length offset is the distance between the tool tip of a target
- Page 3709.SETTING AND DISPLAYING DATA OPERATION B-63784EN-1/01 between the reference measurement surface and the actual measurement surface, which is the height of a workpiece or reference block (Hm), is set separately (see the procedure). Then, tool length offset OFSL can be obtained as shown below: Machin
- Page 371B-63784EN-1/01 OPERATION 9.SETTING AND DISPLAYING DATA (2) Method 2 The tool length offset is defined as the distance between the origin of the workpiece coordinate system and the tool tip position while the machine is positioned to the zero point of the Z-axis of the machine coordinate system. This
- Page 3729.SETTING AND DISPLAYING DATA OPERATION B-63784EN-1/01 In method 2, the reference measurement surface is the origin of the workpiece coordinate system. The tool tip position of the reference tool is also the origin of the workpiece coordinate system. Accordingly, distance L between the tool tip posi
- Page 373B-63784EN-1/01 OPERATION 9.SETTING AND DISPLAYING DATA Machine zero point Tool Tool T01 T01 Zm OFSL Zm OFSL Measurement surface Origin of workpiece coordinate (Reference measurement surface) Hm Hm Workpiece Measurement surface Reference block Machine table Machine table L : Distance between the tool
- Page 3749.SETTING AND DISPLAYING DATA OPERATION B-63784EN-1/01 -Tool replacement position When the tool length offset is set in tool length measurement by pressing the [MEASURE] or [MEASUR+] soft key, the tool automatically moves to the tool replacement position. A reference position is selected beforehand
- Page 375B-63784EN-1/01 OPERATION 9.SETTING AND DISPLAYING DATA Procedure for measuring the workpiece origin offset The workpiece origin offset can be easily measured not only on the longitudinal axis of the tool, or the Z-axis but also on the X-axis and Y-axis in the plane orthogonal to the Z-axis. The work
- Page 3769.SETTING AND DISPLAYING DATA OPERATION B-63784EN-1/01 5 Position the cursor to a desired workpiece origin offset of G54 to G59. The cursor may not be on the workpiece origin offset on the Z-axis. 6 Bring the tool into contact with the top surface of the workpiece by manual handle feed or jog feed.
- Page 377B-63784EN-1/01 OPERATION 9.SETTING AND DISPLAYING DATA - Procedure for measuring a workpiece origin offset on the X-axis or Y-axis, based on a reference surface The measurement procedure in which the workpiece origin for the X- axis or Y-axis is set on a surface of a workpiece is basically the same
- Page 3789.SETTING AND DISPLAYING DATA OPERATION B-63784EN-1/01 Fig. 9.10 (e) Workpiece Origin Offset Screen Displayed in Workpiece Origin Measurement 7 Move the measurement probe to a second measurement point. Meanwhile, the CNC locks the movement in the direction toward the current measurement point. For i
- Page 379B-63784EN-1/01 OPERATION 9.SETTING AND DISPLAYING DATA Description -Workpiece origin offset on the Z-axis Methods 1 and 2 in "Definition of the Tool Length Offset" in the description of the procedure for measuring the tool length offset generally apply to the definition of workpiece origin offset on
- Page 3809.SETTING AND DISPLAYING DATA OPERATION B-63784EN-1/01 As shown in the figure, the workpiece origin offset on the Z-axis can be obtained as follows: OFSW = Zm - OFSL where OFSW: Workpiece origin offset OFSL: Tool length offset of a tool used to measure the workpiece origin offset Zm: Amount of trave
- Page 381B-63784EN-1/01 OPERATION 9.SETTING AND DISPLAYING DATA The workpiece origin offset can be obtained using method 2, in the same way as in method 1. OFSW=Zm-OFSL where OFSW : Workpiece origin offset OFSL : Tool length offset of a tool with which the workpiece origin offset is measured Zm : Amount of t
- Page 3829.SETTING AND DISPLAYING DATA OPERATION B-63784EN-1/01 +Z +X Tool Workpiec OFSR Xm OFSW Machine zero point Workpiece origin OFSR : Tool radius offset of a tool used to measure the workpiece origin offset Xm : Amount of travel from the machine zero point to the workpiece origin for measurement with a
- Page 383B-63784EN-1/01 OPERATION 9.SETTING AND DISPLAYING DATA (2) When the center of a hole is set as the workpiece origin +Y Workpiece +X Origin of workpiece Workpiece coordinate system origin offset on the Y-axis Machine zero point Workpiece origin offset on the X-axis In the example shown above, the cen
- Page 3849.SETTING AND DISPLAYING DATA OPERATION B-63784EN-1/01 9.11 MENU SWITCHES With the menu switch function, some DI signals entered with the signal (BMI interface) from the machine can be set by CNC screen operation. Screen configuration To display the menu switch screen, follow the procedure described
- Page 385B-63784EN-1/01 OPERATION 9.SETTING AND DISPLAYING DATA Operation - Positioning the cursor Using the cursor keys , position the cursor. The cursor keys cannot be used. - Turning on a switch Method 1:Press the [ON:1] soft key. Method 2:Press the numeric key 1 then the INPUT key. Method 3:Press the num
- Page 3869.SETTING AND DISPLAYING DATA OPERATION B-63784EN-1/01 9.12 DISPLAYING AND SETTING TOOL LIFE MANAGEMENT DATA Tool life management data can be displayed on the screen to check the current tool life management status. In addition, the screen can be used to edit tool life management data. The screen co
- Page 387B-63784EN-1/01 OPERATION 9.SETTING AND DISPLAYING DATA Count override : When the tool life count override signal is disabled (with bit 3 (LFV) of parameter No. 7401 set to 0), 1.0 times is indicated. - Data (B) The set service life values, current tool life counter values, and registered tool number
- Page 3889.SETTING AND DISPLAYING DATA OPERATION B-63784EN-1/01 Tool life management (group editing) Display the tool life management group editing screen by pressing the soft key on the tool life management directory screen. (A) (B) Fig.9.12 (b) Tool Life Management (Group Editing) Screen - Data (A) As with
- Page 389B-63784EN-1/01 OPERATION 9.SETTING AND DISPLAYING DATA - Data (B) The detailed tool life management data for a selected group is displayed as described below. Type : 1 Count-based life counting 2 Time-based life counting Life value : Tool life value Counter : Tool life counter Status : * Indicates t
- Page 3909.SETTING AND DISPLAYING DATA OPERATION B-63784EN-1/01 Setting/editing tool life management data Tool life management (directory) - Switching between pages PAGE Using the page keys PAGE , the previous or following groups can be displayed. - Selecting a group Method 1 (1) Press the [GROUP NUMBER] sof
- Page 391B-63784EN-1/01 OPERATION 9.SETTING AND DISPLAYING DATA - Skipping of tools Among the tools registered in a specified group, the tool to be selected next is skipped. Method 1 (1) Press the [SKIP] soft key. (2) Enter a group number. (3) Press the [EXEC] soft key. Method 2 (1) Enter a group number. (2)
- Page 3929.SETTING AND DISPLAYING DATA OPERATION B-63784EN-1/01 - Switching between pages PAGE With the page keys PAGE , the previous or following groups can be displayed. - Selecting a group Method 1 (1) Press the [GROUP NUMBER] soft key. (2) Enter a group number. (3) Press the [EXEC] soft key. Method 2 (1)
- Page 393B-63784EN-1/01 OPERATION 9.SETTING AND DISPLAYING DATA - Adding a tool group Method 1 (1) Select a group for which no data is set. (2) Position the cursor to the tool data (state, T code, H code, or D code). (3) Press the [ADD T CODE] soft key. (4) Enter a tool number. (5) Press the [EXEC] soft key.
- Page 3949.SETTING AND DISPLAYING DATA OPERATION B-63784EN-1/01 - Deleting a tool group (1) Select the group you want to delete. (2) Press the [DELETE] soft key. (3) Press the [GROUP] soft key. (4) Press the [EXEC] soft key. - Deleting tool data (1) Position the cursor to the tool data (state, T code, H code
- Page 395B-63784EN-1/01 OPERATION 9.SETTING AND DISPLAYING DATA - Setting for tool clearing (restart of service life) Method 1 (1) Position the cursor to the tool data (state, T code, H code, or D code) of the tool you want to clear. (2) Press the [STATE] soft key. (3) Press the [CLEAR] soft key. Method 2 (1
- Page 3969.SETTING AND DISPLAYING DATA OPERATION B-63784EN-1/01 9.13 DISPLAYING AND SETTING THE SOFTWARE OPERATOR'S PANEL MDI panel operations can substitute for the functions of switches on the machine operator's panel. For example, mode selection and jog feed override selection can be made by operations on
- Page 397B-63784EN-1/01 OPERATION 9.SETTING AND DISPLAYING DATA - Manual handle Select the axis on which a movement is to be made with the first handle, and also select a magnification. - Override Set an override value for the rapid traverse rate, jog feedrate, cutting feedrate, and spindle speed. - Automati
- Page 3989.SETTING AND DISPLAYING DATA OPERATION B-63784EN-1/01 Jog feed based on numeric keys By parameter setting (No. 2020, No. 2021), jog feed can be specified using the MDI keys after assigning move axes to the MDI keys (1 to 4, 6 to 9). As move axes, the first axis to the sixth axis can be specified. N
- Page 399B-63784EN-1/01 OPERATION 9.SETTING AND DISPLAYING DATA 9.14 DISPLAYING AND SETTING TOOL OFFSET DATA BASED ON TOOL NUMBERS On the tool offset data screen, the tool length compensation values, cutter compensation values, and tool pot numbers for tool numbers (T code) can be displayed and set. Displayi
- Page 4009.SETTING AND DISPLAYING DATA OPERATION B-63784EN-1/01 (D) Length Length represents a tool length compensation value. When a tool number is specified, the tool compensation value corresponding to the tool number is used for tool length compensation. (E) Radius Radius represents a cutter compensation
- Page 401B-63784EN-1/01 OPERATION 9.SETTING AND DISPLAYING DATA Selecting and setting tool offset data Entering and modifying tool offset data Method 1 (1) Position the cursor to the data you want to enter or modify. (2) Press the [INPUT] soft key. (3) Enter data. (4) Press the [EXEC] soft key. Method 2 (1)
- Page 4029.SETTING AND DISPLAYING DATA OPERATION B-63784EN-1/01 Adding a tool number Method 1 (1) Position the cursor to the data immediately preceding the display number you want to add. (2) Press the [INSERT] soft key. (3) Press the [(T#)] soft key. (4) Enter a tool number. (5) Press the [EXEC] soft key. M
- Page 403B-63784EN-1/01 OPERATION 9.SETTING AND DISPLAYING DATA Deleting tool offset data (1 line) Method 1 (1) Press the [DELETE] soft key. (2) Key in the display number of the data you want to delete. (3) Press the [EXEC] soft key. Method 2 (1) Key in the display number of the data you want to delete. (2)
- Page 4049.SETTING AND DISPLAYING DATA OPERATION B-63784EN-1/01 Searching for tool numbers Method 1 (1) Press the [SEARCH] soft key. (2) Press the [(T#)] soft key. (3) Enter a tool number. (4) Press the [EXEC] soft key. Method 2 (1) Press the [SEARCH] soft key. (2) Press the T address key. (3) Enter a tool n
- Page 405B-63784EN-1/01 OPERATION 9.SETTING AND DISPLAYING DATA Method 6 (1) Press the P address key. (2) Press the [SEARCH] soft key. NOTE If a search is made based on the same pot number (method 4 to method 6) without performing even one search operation based on a pot number (method 1 to method 3), a warn
- Page 4069.SETTING AND DISPLAYING DATA OPERATION B-63784EN-1/01 Tool offset data input/output Tool offset data input Method 1 (Neither the input file name nor number need be specified) (1) Select MDI mode. (2) Press the [READ] soft key. (3) Press the [NUMBER OFFSET] soft key. Method 2 (The input file is spec
- Page 407B-63784EN-1/01 OPERATION 9.SETTING AND DISPLAYING DATA Tool offset data output Method 1 (when neither an output file name nor a file number is specified) (1) Press the [PUNCH] soft key. (2) Press the [NUMBER OFFSET] soft key. Method 2 (The output file is specified with its file name) (1) Press the [
- Page 4089.SETTING AND DISPLAYING DATA OPERATION B-63784EN-1/01 Input/output using other screens Tool offset data input/output is possible on the floppy directory screen and memory card screen in addition to the tool offset data screen. For details, see Section II-10.12, "Floppy Directory Screen" and Section
- Page 409B-63784EN-1/01 OPERATION 9.SETTING AND DISPLAYING DATA 9.15 FLOATING REFERENCE POSITION SETTING The floating reference position is a position on the machine used as a reference for a machine operation. The floating reference position is not always fixed, but can be moved, depending on the situation.
- Page 4109.SETTING AND DISPLAYING DATA OPERATION B-63784EN-1/01 Presetting the relative coordinate system With bit 1 (FPC) of parameter No. 1200, a floating reference position can be memorized, and the relative position indication can be preset to 0 as well. - 388 -
- Page 411B-63784EN-1/01 OPERATION 9.SETTING AND DISPLAYING DATA 9.16 SERVO SPINDLE SCREEN The servo spindle screen is used to set servo spindle parameters and monitor the operation status. The user can set servo spindle parameters and monitor the operation status without being concerned with parameter and di
- Page 4129.SETTING AND DISPLAYING DATA OPERATION B-63784EN-1/01 9.17 COMMUNICATION SETTING SCREEN The communication setting screen is used to set RS-232C, RS-422, and input/output devices such as memory cards. Display Follow the procedure described in Section II-2.3, 2.5, "Offset Setting" to display the comm
- Page 413B-63784EN-1/01 OPERATION 9.SETTING AND DISPLAYING DATA - Setting RS-232C/RS-422 Set the communication conditions for each channel of RS-232C and RS-422. A parameter set specifying a device specification, stop bit, and baud rate as indicated below is assigned to each channel according to the device n
- Page 4149.SETTING AND DISPLAYING DATA OPERATION B-63784EN-1/01 Setting data 1) Select MDI mode. 2) With the cursor keys , position the cursor to the item you want to set. 3) Select a setting with the [SELECT+] and [SELECT-] soft keys. NOTE 1 For channels whose device numbers (parameter No. 5001 to No. 5003,
- Page 415B-63784EN-1/01 OPERATION 9.SETTING AND DISPLAYING DATA 9.18 HIGH-SPEED HIGH-PRECISION MACHINING SETTING SCREEN The high-speed high-precision machining setting screen displays parameters associated with high-speed high-precision machining. This screen can be used to save and switch between three type
- Page 4169.SETTING AND DISPLAYING DATA OPERATION B-63784EN-1/01 (B) Setting items The settings of the items that can be set on this screen are reflected in the parameters. A different parameter number is used to reflect the setting of the same item when a different parameter set is used. Finish level (FINISH
- Page 417B-63784EN-1/01 OPERATION 9.SETTING AND DISPLAYING DATA Corner feedrate difference (CORNER FEED) When the feedrate difference between two blocks exceeds the value set in this item, the tool is decelerated at the corner to prevent the value set in this item from being exceeded. The unit is mm/sec or i
- Page 4189.SETTING AND DISPLAYING DATA OPERATION B-63784EN-1/01 - Setting items The settings of the items that can be set on this screen are reflected in the parameters. Modal multibuffer enable (MULTI BUFFER AUTO ENABLE) This item specifies whether to make the multibuffer mode modal. The setting of this ite
- Page 419B-63784EN-1/01 OPERATION 9.SETTING AND DISPLAYING DATA Automatic adjustment Based on the cutting level (finish level) of a specified parameter set, the settings of the other items are automatically calculated, and set in the parameters. Note, however, that only guideline values are set in automatic
- Page 4209.SETTING AND DISPLAYING DATA OPERATION B-63784EN-1/01 Displaying parameter numbers The parameter numbers in which the adjustment screen items are set can be checked. Procedure (1) Display the adjustment screen, then press the [AUX] soft key. Parameter numbers are displayed instead of the setting ma
- Page 421B-63784EN-1/01 OPERATION 9.SETTING AND DISPLAYING DATA Setting of parameters of axis type on an axis-by-axis basis When an item of a parameter of axis type is specified on the adjustment screen, the same value is set for all axes except an axis specified by bit 7 (NFF) of parameter No. 1009. The dis
- Page 4229.SETTING AND DISPLAYING DATA OPERATION B-63784EN-1/01 9.19 CALCULATION KEY The expression entered in the key-in buffer is evaluated by pressing the ALTER calculation key SHIFT CALC . Operation - Evaluating a single expression (1) Enter an expression in the key-in buffer. ALTER (2) Press the calcula
- Page 423B-63784EN-1/01 OPERATION 9.SETTING AND DISPLAYING DATA - Elements that can be used in expressions (1) Numeric values (2) Operators representing the four basic arithmetic functions, +, -, *, and / (3) Brackets [ and ] (4) Functions Table 9.19(a) Functions That Can be Used with the Calculation Key Fun
- Page 4249.SETTING AND DISPLAYING DATA OPERATION B-63784EN-1/01 - Operation precision The operation precision for the real type is the same as that for custom macro operation commands. Warnings Message Description FORMAT ERROR The expression is not in the correct format. DATA IS OUT OF RANGE The calculation
- Page 425B-63784EN-1/01 OPERATION 9.SETTING AND DISPLAYING DATA 9.20 POWER MATE CNC MANAGER FUNCTION When power motion series units are used as CNC additional (slave) axes, the Power Mate CNC manager function enables the data for the slave axes to be displayed and specified on the CNC side. Specifically, the
- Page 4269.SETTING AND DISPLAYING DATA OPERATION B-63784EN-1/01 - Slave state display and selection operations The following information related to the connected slaves (up to 8) is displayed at the top of the screen. - I/O Link group numbers (0 to 15) - Alarm conditions The cursor is positioned to the slave
- Page 427B-63784EN-1/01 OPERATION 9.SETTING AND DISPLAYING DATA - Axis name display The name of a slave axis can be changed using parameter Nos. 2090 to 2097. (The axis name is represented using A to Z ASCII codes.) If no axis name has been specified, or if any specified data is invalid, the axis name appear
- Page 4289.SETTING AND DISPLAYING DATA OPERATION B-63784EN-1/01 - Parameter selection and search To select a desired parameter number, position the cursor to the parameter number by pressing the cursor keys PAGE and the PAGE page keys. Alternatively, search for a desired parameter by means of the following p
- Page 429B-63784EN-1/01 OPERATION 9.SETTING AND DISPLAYING DATA (1) Parameter input Enter the parameter using the following procedure. (1) Select EDIT mode. (Terminate background editing.) (2) Select a slave axis for which the parameter is to be input. (3) Press soft key [READ PM -> NC]. (4) Pressing soft ke
- Page 4309.SETTING AND DISPLAYING DATA OPERATION B-63784EN-1/01 - Display method (1) Press soft key [PMM]. (2) Press soft key [CHAPTER]. (3) Press soft key [DIAGNOSIS]. Fig. 9.20 (d) Power Mate CNC Manager Diagnosis Screen - Diagnostic data search PAGE Pressing the PAGE page keys scrolls the screen. Alternat
- Page 431B-63784EN-1/01 OPERATION 9.SETTING AND DISPLAYING DATA - Display method (1) Press soft key [PMM]. (2) Press soft key [CHAPTER]. (3) Press soft key [MESSAGE]. Fig. 9.20 (e) Power Mate CNC Manager Alarm Screen Fig.9.20(e) shows an example of displaying alarm information about the power motion machine
- Page 4329.SETTING AND DISPLAYING DATA OPERATION B-63784EN-1/01 9.21 MODEM CARD SETTING SCREEN In the case that a Modem card is used for the Remote Diagnosis, when initial commands (AT commands) special for Modem card have been set, those initial commands are automatically output to a Modem card at starting
- Page 433B-63784EN-1/01 OPERATION 9.SETTING AND DISPLAYING DATA Operation on the Modem setting screen - Setting the Initial commands The initial commands which are output to the Modem card at starting the Remote Diagnosis are set. At starting the Remote Diagnosis, CNC always outputs the following basic initi
- Page 4349.SETTING AND DISPLAYING DATA OPERATION B-63784EN-1/01 - Input of special character When characters which can not be set from MDI keys should be set, input such characters in the following way. -Input from soft keys (1) Press soft key [SPECIAL CHAR]. (2) Select special characters from soft keys and
- Page 435B-63784EN-1/01 OPERATION 9.SETTING AND DISPLAYING DATA 9.22 CHANGING ACTIVE OFFSET VALUE WITH MANUAL MOVE If you want to perform roughing or semi-finishing with a single tool, you may fine-adjust the tool length compensation or cutter compensation. Moreover, you may want to fine-adjust the setting o
- Page 4369.SETTING AND DISPLAYING DATA OPERATION B-63784EN-1/01 - Changing the tool length compensation This function can change the tool length compensation identified by the offset number corresponding to an H code specified during automatic operation. If there is no valid tool length compensation (for exa
- Page 437B-63784EN-1/01 OPERATION 9.SETTING AND DISPLAYING DATA - Changing the workpiece origin offset This function can change the workpiece origin offset of an individual axis of the workpiece coordinate system corresponding to G54 to G59 or G54.1P1 to P48 specified during automatic operation. There is a c
- Page 4389.SETTING AND DISPLAYING DATA OPERATION B-63784EN-1/01 - Operations specific to individual tool offset memory types The offset to be changed varies with what tool offset memory (A, B, or C) is used, as listed below. Tool offset Offset to be changed memory A The tool length compensation and cutter co
- Page 439B-63784EN-1/01 OPERATION 9.SETTING AND DISPLAYING DATA - Emergency stop and SV alarm If the servo power is switched off (for example, when the machine is brought to an emergency stop or an SV alarm occurs), axis movement caused by follow-up is reflected to the offset during active offset change mode
- Page 4409.SETTING AND DISPLAYING DATA OPERATION B-63784EN-1/01 9.23 DO SIGNAL OUTPUT BY SOFT KEY A DO signal can be output by pressing a soft key. When any CNC screen is displayed, a DO signal can be output by soft key operation. This allows the machine tool builder to assign desired functions to soft keys.
- Page 441B-63784EN-1/01 OPERATION 9.SETTING AND DISPLAYING DATA 9.24 AUTOMATIC FEEDRATE CONTROL BY AREA Displaying the area setting screen Press the [Setting] key several times to display the area setting screen for automatic feedrate control. Fig.9.24 (f) Area Setting Screen for Automatic Feedrate Control N
- Page 4429.SETTING AND DISPLAYING DATA OPERATION B-63784EN-1/01 Setting the coordinates of diagonal vertexes - Setting mode Set MDI mode. - Moving the cursor Position the cursor to the coordinate field of a desired area number by using the cursor keys . - Inputting values (Absolute input) Method 1 (1) Press
- Page 443B-63784EN-1/01 OPERATION 9.SETTING AND DISPLAYING DATA Setting an area override - Setting mode Set MDI mode. - Moving the cursor Position the cursor to the coordinate field of a desired area number by using the cursor keys . - Inputting values (Absolute input) Method 1 (1) Press soft key [INPUT]. (2
- Page 4449.SETTING AND DISPLAYING DATA OPERATION B-63784EN-1/01 9.25 DIAMETER ENTRY FOR TOOL COMPENSATION VALUE The tool compensation value recorded in CNC offset memory can be used as the diameter. By setting bit 0 (ODI) of parameter No. 6008 to 1, you can use the tool compensation value recorded in offset
- Page 445B-63784EN-1/01 OPERATION 10.DISPLAY 10 DISPLAY - 423 -
- Page 44610.DISPLAY OPERATION B-63784EN-1/01 10.1 PROGRAM DISPLAY During operation in MEM or MDI mode, the program currently being executed can be displayed. Displaying the contents of the program On the program screen, the contents of the program currently being executed are displayed. Follow the procedure
- Page 447B-63784EN-1/01 OPERATION 10.DISPLAY Displaying a program list On the program directory screen, a list of programs registered in the program memory appears. Follow the procedure described in Section II-10.1, "Programs" to display the program directory screen. The program directory screen contains a s
- Page 44810.DISPLAY OPERATION B-63784EN-1/01 - Program directory screen (number and name display) Fig.10.1 (c) Program Directory Screen (Number and Name Display) The numbers and names of the registered programs are listed together with the program sizes. At the bottom of the screen, the free space in program
- Page 449B-63784EN-1/01 OPERATION 10.DISPLAY Checking programs The program check screen contains three screens. Follow the procedure described in Section II-10.1, "Programs" to display the program check screen. - Program check screen (D) Current position display (E) Modal and other information (A) Program (B
- Page 45010.DISPLAY OPERATION B-63784EN-1/01 (D) Current position The current positions in the relative, absolute, and machine coordinate systems can be displayed, as well as the remaining amount of travel. To display the current positions in the relative and machine coordinate systems, press the [RELATIVE]
- Page 451B-63784EN-1/01 OPERATION 10.DISPLAY - Previous block screen (B) Call information (C) Program (A) Previous block modal information Fig. 10.1 (e) Previous Block Screen On the previous block screen, the following items of information, related to the block executed last, are displayed: (A) Previous bloc
- Page 45210.DISPLAY OPERATION B-63784EN-1/01 - Active block screen (B) Call information (C) Program (A) Active block modal information Fig. 10.1 (f) Active Block Screen On the active block screen, the following items of information, related to the block currently being executed, are displayed: (A) Active blo
- Page 453B-63784EN-1/01 OPERATION 10.DISPLAY 10.2 PROGRAM AND SEQUENCE NUMBER DISPLAY, STATUS DISPLAY, AND DATA SETTING AND INPUT/OUTPUT OPERATION WARNING DISPLAY The program number, sequence number, and the current CNC status are constantly displayed on the screen (except immediately after the power is turn
- Page 45410.DISPLAY OPERATION B-63784EN-1/01 10.3 PROGRAM AND SEQUENCE NUMBER DISPLAY The program and sequence numbers of the program currently executing are displayed at the upper right corner of the screen. Sequence number Program number Fig. 10.3 Program and Sequence Number Display - 432 -
- Page 455B-63784EN-1/01 OPERATION 10.DISPLAY 10.4 STATUS DISPLAY AND DATA SETTING AND INPUT/OUTPUT OPERATION WARNING DISPLAY The currently selected mode, automatic operation status, alarm status, program editing status, and other information are displayed on the second line from the top of the screen. This a
- Page 45610.DISPLAY OPERATION B-63784EN-1/01 Status display Display contents 1 2 3 1 Automatic operation mode selection This field displays the automatic operation mode currently selected. MDI : MDI operation MEM : Memory operation DNC : DNC operation EDIT : Memory operation **** : Automatic operation is not
- Page 457B-63784EN-1/01 OPERATION 10.DISPLAY 5 Axis movement/dwell/emergency stop status This field indicates the axis movement, dwell, or emergency stop status. MTN : Movement along an axis is in progress. DWL : The machine is dwelling. EMG : An emergency stop is in progress. *** : None of the above 6 M/S/T
- Page 45810.DISPLAY OPERATION B-63784EN-1/01 Data setting and input/output operation warning display When an attempt is made to set data, but the keyed-in data contains an error (such as an invalid format or the valid range being executed) or it cannot be input (because of, for example, an invalid mode or wr
- Page 459B-63784EN-1/01 OPERATION 10.DISPLAY 10.5 CURRENT POSITION DISPLAY Four current-position screens are used. - Overall position display screen - Current-position screen based on the relative coordinate system - Current-position screen based on the workpiece coordinate system - Current-position screen b
- Page 46010.DISPLAY OPERATION B-63784EN-1/01 Display contents - Current position The current positions in the following coordinate systems are displayed simultaneously: RELATIV : Displays the current position in the relative coordinate system ABSOLUT : Displays the current position in the workpiece coordinat
- Page 461B-63784EN-1/01 OPERATION 10.DISPLAY Display of the current position in the relative coordinate system Relative-position display screen On this screen, the current position in the relative coordinate system that is relative to the operator-specified coordinates is displayed. Fig.10.5 (b) Relative-Pos
- Page 46210.DISPLAY OPERATION B-63784EN-1/01 Display of the current position in the workpiece coordinate system Absolute-position display screen On this screen, the current (absolute) position in the workpiece coordinate system is displayed. Fig.10.5 (c) Absolute-Position Display Screen Display contents - Cu
- Page 463B-63784EN-1/01 OPERATION 10.DISPLAY Display of the current position in the machine coordinate system Machine position display screen The current position in the machine coordinate system is displayed. Fig.10.5 (d) Machine Position Display Screen Display contents - Current position The current positi
- Page 46410.DISPLAY OPERATION B-63784EN-1/01 10.5.1 Presetting the Current Position The current positions in the relative and workpiece coordinate systems can be preset. The current position in the workpiece coordinate system can be preset using program command G92. For details of presetting the current posi
- Page 465B-63784EN-1/01 OPERATION 10.DISPLAY Setting the current position to specified coordinates To set the current position to specified coordinates in the relative coordinate system, use either of the following methods on the overall position display screen or the relative-position display screen. To set
- Page 46610.DISPLAY OPERATION B-63784EN-1/01 10.5.2 Presetting a Workpiece Coordinate System A workpiece coordinate system that has been shifted because of, for example, manual intervention, can be preset to the previous position of the workpiece coordinate system, set off from the machine zero point by the
- Page 467B-63784EN-1/01 OPERATION 10.DISPLAY Examples) X0Y0Z0 [EXEC] This example presets the X-, Y-, and Z-axes of a workpiece coordinate system to the previous position of the workpiece coordinate system. (The offset from the previous position of the workpiece coordinate system is 0 for each axis.) X100.0Y
- Page 46810.DISPLAY OPERATION B-63784EN-1/01 10.6 OPERATOR MESSAGE DISPLAY Operator message display commands cause operator messages to be displayed on the operator message screen. There are two types of operator messages: 1. External operator messages 2. Operator messages generated by custom macro commands
- Page 469B-63784EN-1/01 OPERATION 10.DISPLAY - Clearing operator messages External operator messages can be cleared with external commands. For an explanation of how to clear them, refer to the manual supplied by the machine tool builder. When an operator message generated by a custom macro command is displa
- Page 47010.DISPLAY OPERATION B-63784EN-1/01 10.7 ALARM MESSAGE DISPLAY When an alarm occurs, an alarm message is displayed on the alarm message screen. There are three types of alarm messages: 1 Alarm messages generated by CNC self-diagnosis 2. External alarm messages 3. Alarm messages generated by custom m
- Page 471B-63784EN-1/01 OPERATION 10.DISPLAY - Explanation of alarm messages For an explanation of the alarm messages reported by CNC self- diagnosis, refer to the FANUC Series 15i/150i-MODEL B Maintenance Manual (B-63785EN). For an explanation of external alarm messages, refer to the manual supplied by the
- Page 47210.DISPLAY OPERATION B-63784EN-1/01 10.8 TOOL PATH DRAWING The tool path of the program currently being used for machining can be drawn. This allows checking of the progress of machining and the tool's current position. The following functions are supported: - Display the current position of the too
- Page 473B-63784EN-1/01 OPERATION 10.DISPLAY - Tool path In the graphic coordinate system, which is set with the appropriate graphic parameter, described later, the tool path in the workpiece coordinate system is drawn. The position drawn depends on the setting of parameter DTL (bit 2 of No. 2202), as follow
- Page 47410.DISPLAY OPERATION B-63784EN-1/01 Graphic parameter screen Follow the procedure described in Section II-2.3, 2.5, "Graphics" to display the graphic parameter screen. The parameters required to draw a tool path are specified on the graphic parameter screen. The graphic parameter screen contains two
- Page 475B-63784EN-1/01 OPERATION 10.DISPLAY - Page 2 of the graphic parameter screen Fig.10.8 (d) Page 2 of the Graphic Parameter Screen On page 2 of the graphic parameter screen, set the graphic coordinate axes. - 453 -
- Page 47610.DISPLAY OPERATION B-63784EN-1/01 Graphic parameters To draw a tool path, set the graphic coordinate system, tool path graphic colors, and graphic range on the graphic parameter screen. The following explains the graphic parameters to be specified on the graphic parameter screen. Merely specifying
- Page 477B-63784EN-1/01 OPERATION 10.DISPLAY Z X" X' Y' Y" 30 ‹ 180° Horizontal plane of rotation X Y Fig.10.8 (f) Horizontal Rotation of a Coordinate System - Vertical rotation angle When the selected graphic coordinate system is a three-dimensional one, such as 7 (XYZ), 8 (YZX), or 9 (ZXY), the coordinate
- Page 47810.DISPLAY OPERATION B-63784EN-1/01 - Graphic colors Set the number of the graphic color representing cutting feed, rapid traverse, and reverse in the tool path. 0 : White 1 : Red 2 : Green 3 : Yellow 4 : Blue 5 : Purple 6 : Light blue 7 : White - Setting the graphic range To draw a tool path within
- Page 479B-63784EN-1/01 OPERATION 10.DISPLAY - Graphic axis numbers Specify which controlled axes are to be assigned to the graphic axes. First graphic axis : 1 Second graphic axis : 2 Third graphic axis : 3 Axis not subject to drawing : 0 NOTE 1 When the maximum and minimum of the graphic range are set, the
- Page 48010.DISPLAY OPERATION B-63784EN-1/01 Specifying the graphic parameters - Moving the cursor PAGE Use PAGE the page keys and the cursor keys to position the cursor to the desired parameter. It is not possible to move between pages with the cursor keys. - Inputting settings (absolute input) METHOD1 Pres
- Page 481B-63784EN-1/01 OPERATION 10.DISPLAY Executing tool path drawing - Starting drawing (1) Display the tool path drawing screen. (2) Press the [START] soft key. "DRAW" is displayed in the drawing status display portion, and the system enters that state in which tool movement during automatic or manual o
- Page 48210.DISPLAY OPERATION B-63784EN-1/01 Graphic shift/enlarge After a tool path has been drawn on the tool path drawing screen, it is possible to shift the center of drawing and enlarge part of the drawing. The shift and enlarge operations cannot be performed while a tool path is being drawn. Graphic sh
- Page 483B-63784EN-1/01 OPERATION 10.DISPLAY Graphic enlarge A specified rectangular area can be drawn enlarged. - Operation procedure (1) Press the [ENLARGE] soft key. A red and a yellow cursor are displayed in the middle of the screen, and the soft key display changes. (2) Use the [↑][↓][→][←] soft keys to
- Page 48410.DISPLAY OPERATION B-63784EN-1/01 Storing and canceling the settings of graphic shift/enlarge The settings of graphic shift/enlarge can be stored in the appropriate graphic parameters. (The settings of graphic shift/enlarge are not automatically stored in the graphic parameters, but are cleared wh
- Page 485B-63784EN-1/01 OPERATION 10.DISPLAY 10.9 OPERATING MONITOR SCREEN This screen presents real-time bar charts of the loads imposed on the servo and spindle motors. When a single servo or spindle motor is selected, a waveform is displayed to indicate the per-minute fluctuations of the load on the motor
- Page 48610.DISPLAY OPERATION B-63784EN-1/01 3 Load meter Loads on up to one spindle motor and three servo motors are shown on bar charts in real time. The spindle motor selected with parameter No. 5850 or the spindle switching function is displayed on this screen. For the servo motors, parameters No. 2231 t
- Page 487B-63784EN-1/01 OPERATION 10.DISPLAY 10.10 DISPLAY AND SETTING OF THE PARTS COUNTS, OPERATING TIME, AND CLOCK The total machined parts count, required parts count, and machined parts count are displayed. Also displayed are the cumulative power-on time, cumulative automatic operation time, cumulative
- Page 48810.DISPLAY OPERATION B-63784EN-1/01 (A) Parts counts Total machined parts count A cumulative value, which is incremented by 1 when M02, M30, or the M code specified for parameter No. 2426 is executed. The value cannot be set from this screen. It can be set for parameter No. 108. Required parts count
- Page 489B-63784EN-1/01 OPERATION 10.DISPLAY (C) Clock Date/time The current date and time is displayed. The date and time can be set from this screen. Usage Counting the number of parts When the M02 or M30 command is executed, the total machined parts count and the machined parts count are incremented by 1.
- Page 49010.DISPLAY OPERATION B-63784EN-1/01 10.11 BACKGROUND DRAWING Background drawing allows the tool path of a program to be drawn without machining. It also enables the tool path of another program to be drawn during machining. Background drawing is faster than ordinary tool path drawing, thereby allowi
- Page 491B-63784EN-1/01 OPERATION 10.DISPLAY - Tool path In the graphic coordinate system, which is set with the appropriate graphic parameter, described later, the tool path in the workpiece or machine coordinate system is drawn. Use parameter No. 2209 to select either the workpiece or machine coordinate sy
- Page 49210.DISPLAY OPERATION B-63784EN-1/01 Graphic parameter screen Follow the procedure described in Section II-2.3, 2.5, "Graphics" to display the graphic parameter screen. The parameters required to draw a tool path are specified on the graphic parameter screen. The graphic parameter screen contains two
- Page 493B-63784EN-1/01 OPERATION 10.DISPLAY - Page 2 of the graphic parameter screen Fig.10.11 (d) Page 2 of the Graphic Parameter Screen On page 2 of the graphic parameter screen, set the graphic coordinate axes. - 471 -
- Page 49410.DISPLAY OPERATION B-63784EN-1/01 Graphic parameters To draw a tool path, set the graphic coordinate system, tool path graphic colors, and graphic range on the graphic parameter screen. The following explains the graphic parameters to be specified on the graphic parameter screen. Merely specifying
- Page 495B-63784EN-1/01 OPERATION 10.DISPLAY - Horizontal rotation angle When the graphic coordinate system selected is a three-dimensional one, such as 7 (XYZ), 8 (YZX), or 9 (ZXY), the coordinate system can be rotated about a horizontal plane of rotation. The rotation angle can be set in the range of -360
- Page 49610.DISPLAY OPERATION B-63784EN-1/01 - Vertical rotation angle When the selected graphic coordinate system is a three-dimensional one, such as 7 (XYZ), 8 (YZX), or 9 (ZXY), the coordinate system can be rotated about a specified vertical rotation axis on a horizontal plane. The rotation angle can be s
- Page 497B-63784EN-1/01 OPERATION 10.DISPLAY 1. Setting the graphic center and the scale factor Set the coordinates of the center of the tool path graphic area, as coordinates in the workpiece coordinate system. Then, set the appropriate scale factor so that the graphic range is contained within the tool pat
- Page 49810.DISPLAY OPERATION B-63784EN-1/01 - Graphic axis numbers Specify which controlled axes are to be assigned to the graphic axes. First graphic axis :1 Second graphic axis :2 Third graphic axis :3 Axis not subject to drawing :0 NOTE 1 When the maximum and minimum of the graphic range are set, the gra
- Page 499B-63784EN-1/01 OPERATION 10.DISPLAY Specifying the graphic parameters - Moving the cursor PAGE Use PAGE the page keys and the cursor keys to position the cursor to the desired parameter. It is not possible to move between pages with the cursor keys. - Inputting settings (absolute input) Method 1 Pre
- Page 50010.DISPLAY OPERATION B-63784EN-1/01 Executing background drawing - Registering the program Register the desired program in memory. Unless it is registered in memory, its tool path cannot be drawn. M02 or M30 must be specified at the end of the program. - Calling the program Press the [REWIND] soft k
- Page 501B-63784EN-1/01 OPERATION 10.DISPLAY Graphic shift/enlarge After a tool path has been drawn on the tool path drawing screen, it is possible to shift the center of drawing and enlarge part of the drawing. The shift and enlarge operations cannot be performed while a tool path is being drawn. Graphic sh
- Page 50210.DISPLAY OPERATION B-63784EN-1/01 Graphic enlarge A specified rectangular area can be drawn enlarged. - Operation procedure (1) Press the [ENLARGE] soft key. A red and a yellow cursor are displayed in the middle of the screen, and the soft key display changes. (2) Use the [↑][↓][→][←] soft keys to
- Page 503B-63784EN-1/01 OPERATION 10.DISPLAY Storing and canceling the settings of graphic shift/enlarge The settings of graphic shift/enlarge can be stored in the appropriate graphic parameters. (The settings of graphic shift/enlarge are not automatically stored in the graphic parameters, but are cleared wh
- Page 50410.DISPLAY OPERATION B-63784EN-1/01 Data handled during background drawing The following items of data are handled during background drawing: 1. Parameters The same parameter settings as those used during ordinary automatic operation are used. During background drawing, parameters cannot be changed.
- Page 505B-63784EN-1/01 OPERATION 10.DISPLAY Functions that behave differently during background drawing The following functions behave differently during background drawing: 1. Custom macros 1 Interface signals #1000 to #1035 are always regarded as being 0. 2 Alarm message output The alarm messages generate
- Page 50610.DISPLAY OPERATION B-63784EN-1/01 6 G60 (unidirectional positioning) Drawing is always performed directly up to the specified position, even if the positioning direction is opposite. 4. Functions that behave differently 1 G02.2/G03.2 (involute interpolation) Circular interpolation is performed if
- Page 507B-63784EN-1/01 OPERATION 10.DISPLAY Functions available during background drawing G00 Positioning G01 Linear interpolation G02/G03 Circular interpolation, Helical interpolation G15/G16 Polar coordinate G17/G18/G19 Plane selection G33 Thread cutting (drawn as linear interpolation) G38 Cutter compensa
- Page 50810.DISPLAY OPERATION B-63784EN-1/01 Drawing start position The drawing start position is determined as follows: 1. If G92, G52, or G92.1 is specified first If G92, G52, G92.1 is followed by the first move command, the point specified with G92, G52, or G92.1 will be the drawing start position. 2. If
- Page 509B-63784EN-1/01 OPERATION 10.DISPLAY 10.12 FLOPPY DIRECTORY SCREEN The floppy directory screen provides functions for using the FANUC Floppy Cassette, FANUC FA Card, FANUC Handy File, and FANUC PROGRAM FILE Mate connected to the serial interface (RS-232C or RS-422) and a variety of utilities. 1 Outpu
- Page 51010.DISPLAY OPERATION B-63784EN-1/01 - Page Select Page information for the file list is displayed. If the list cannot be displayed on a single page, "Prev Page" and "Next Page" are displayed to indicate that there are multiple pages. - DNC Select The names of the files to be loaded during DNC operat
- Page 511B-63784EN-1/01 OPERATION 10.DISPLAY Setting input/output data 1) Press the [DATA SELECT] soft key. The items of data that can be input/output are displayed on the soft keys. If the desired item is not displayed, press the [NEXT DATA] soft key to update the soft key display. 2) Press the soft key cor
- Page 51210.DISPLAY OPERATION B-63784EN-1/01 Searching for a file 1) Press the [NO. SEARCH] soft key. NO. SEARCH is displayed in the key-in buffer. 2) Press the [(FILE#)] soft key. N is added to the key-in buffer. 3) Enter a file number. 4) Press the [EXEC] soft key. File search is executed, and the cursor i
- Page 513B-63784EN-1/01 OPERATION 10.DISPLAY Outputting data 1) Set input/output data. See "Setting input/output data," described earlier. 2) Set the output file name. See "Setting the output file name," described earlier. 3) Perform the necessary operation, according to the table below: Input/output data Ou
- Page 51410.DISPLAY OPERATION B-63784EN-1/01 Deleting a file 1) On the file list, position the cursor to the file to be deleted. See "Displaying a file list," described earlier. 2) Press the DELETE FILE] soft key. 3) Press the [EXEC] soft key. The file is deleted, and the file list is updated. Setting a DNC
- Page 515B-63784EN-1/01 OPERATION 10.DISPLAY 10.13 MEMORY CARD SCREEN The memory card screen provides functions for using a memory card as an external memory unit and a variety of utilities. 1 Output data such as part programs and parameters to an external unit 2 Input data such as part programs and paramete
- Page 51610.DISPLAY OPERATION B-63784EN-1/01 - Free size The amount of free space on the inserted memory card is displayed (in bytes). If the size exceeds 99999999 bytes, ******** is displayed. - Page Select Page information for the file list is displayed. If the list cannot be displayed on a single page, "P
- Page 517B-63784EN-1/01 OPERATION 10.DISPLAY Setting input/output data 1) Press the [DATA SELECT] soft key. The items of data that can be input/output are displayed on the soft keys. If the desired item is not displayed, press the [NEXT DATA] soft key to update the soft key display. 2) Press the soft key cor
- Page 51810.DISPLAY OPERATION B-63784EN-1/01 Searching for a file 1) Press the [NO. SEARCH] soft key. NO. SEARCH is displayed in the key-in buffer. 2) Press the [(FILE#)] soft key. N is added to the key-in buffer. 3) Enter a file number. 4) Press the [EXEC] soft key. File search is executed, and the cursor i
- Page 519B-63784EN-1/01 OPERATION 10.DISPLAY Outputting data 1) Set input/output data. See "Setting input/output data," described earlier. 2) Set the output file name. See "Setting the output file name," described earlier. 3) Perform the necessary operation, according to the table below: Input/output data Ou
- Page 52010.DISPLAY OPERATION B-63784EN-1/01 Deleting a file 1) On the file list, position the cursor to the file to be deleted. See "Displaying a file list," described earlier. 2) Press the [DELETE FILE] soft key. 3) Press the [EXEC] soft key. The file is deleted, and the file list is updated. Formatting a
- Page 521B-63784EN-1/01 OPERATION 10.DISPLAY 10.14 SUB SCREENS On the currently displayed CNC screen (referred to as the main screen in the remainder of this manual), a sub screen can be displayed. This allows the user to perform the following: - Display the actual position on the parts count/run time displa
- Page 52210.DISPLAY OPERATION B-63784EN-1/01 On a single main screen, a single sub screen can be displayed. Different sub screens can be displayed on different main screens. (Switching the main screen causes the sub screen to be switched also.) Once a sub screen is displayed, information about the sub screen
- Page 523B-63784EN-1/01 OPERATION 10.DISPLAY - Actual position For the actual position, the following items of information can be displayed: (1) Relative coordinates (2) Absolute coordinates (3) Machine coordinates (4) Remaining amount of travel (5) Manual interrupt amount (only when the manual handle interr
- Page 52410.DISPLAY OPERATION B-63784EN-1/01 - Tool offset Tool offset values are displayed. The number of sets displayed can be changed by enlarging/reducing the sub screen in the horizontal and vertical directions. When the sub screen is in the edit state, tool offset values can be entered. Fig. 10.14 (d)
- Page 525B-63784EN-1/01 OPERATION 10.DISPLAY - Work zero offset Work zero offset values are displayed. The number of sets displayed can be changed by enlarging/reducing the sub screen in the horizontal and vertical directions. When the sub screen is in the edit state, workpiece origin offsets can be entered.
- Page 52610.DISPLAY OPERATION B-63784EN-1/01 - Modal information Modal information is displayed. The same modal information as that displayed on the program check screen is displayed. This sub screen cannot be enlarged/reduced. Fig. 10.14 (j) Modal information - DI/DO signals Bit images of the DI/DO signals
- Page 527B-63784EN-1/01 OPERATION 10.DISPLAY - Alarm messages Alarm messages are displayed. This sub screen can be enlarged/reduced in the horizontal and vertical directions. Fig. 10.14 (m) Alarm messages - Operator messages Operator messages are displayed. Note that one of the following options must be prov
- Page 52810.DISPLAY OPERATION B-63784EN-1/01 (2) Main screen edit state In this state, the sub screen is displayed but the object of editing is the main screen. The title bar of the sub screen is dark gray. PAGE Page keys PAGE , cursor keys , and soft keys all act on the main screen. (3) Main screen edit sta
- Page 529B-63784EN-1/01 OPERATION 10.DISPLAY Operation - Displaying a sub screen To display a sub screen, press SHIFT , then numeric key 1 . A sub screen is displayed in the sub screen edit state and the soft keys change to those for the sub screen. - Display items on a sub screen To change the display item
- Page 53010.DISPLAY OPERATION B-63784EN-1/01 - Closing a sub screen To close a sub screen, press SHIFT , then numeric key 8 . Depending on which screen is in the edit state, the sub screen can also be closed as described below. (1) If the sub screen is in the edit state Press SHIFT , then numeric key 1 . Alt
- Page 531B-63784EN-1/01 OPERATION 10.DISPLAY - Switching the position information type in the actual position display In the actual position display, the type of position information displayed can be switched. In the sub screen edit state, click soft key [SELECT POS]. The title of the position information ty
- Page 53210.DISPLAY OPERATION B-63784EN-1/01 10.15 HELP FUNCTION The help function displays detailed information about the alarms that may be generated in the CNC, as well as an explanation of G code formats. The following types of information can be displayed. - Alarm help If an attempt is made to operate t
- Page 533B-63784EN-1/01 OPERATION 10.DISPLAY 10.15.1 Help Menu The help menu lists the available help items. From this menu, the screen for any help item can be displayed. - Display method 1. When the HELP key is pressed, the help menu is displayed if neither of the conditions for displaying the help items,
- Page 53410.DISPLAY OPERATION B-63784EN-1/01 10.15.2 Alarm Help A detailed explanation of an alarm can be displayed. The explanation can be displayed in either of two ways: (1) Display the help for an alarm that has been generated (2) Display the help for a desired alarm - Display method 1. If an alarm has b
- Page 535B-63784EN-1/01 OPERATION 10.DISPLAY - Operation method (if no alarm has been generated) 1. From the help menu screen, select "2. Alarm Detailed (All Alarm)" 2. A list of alarm types (such as PS, BG, and SV) is displayed. 3. From this list, use cursor keys to select the desired alarm type, enter the
- Page 53610.DISPLAY OPERATION B-63784EN-1/01 9. To move from the alarm type selection screen to the help menu, perform either of the following: - Press the CAN key. - Select the choice "11. Display help menu " using cursor keys , and press the INPUT key. 10. To display details of the alarm that has been gene
- Page 537B-63784EN-1/01 OPERATION 10.DISPLAY 10.15.3 G Code Help For reference in part programming in NC format, two types of help can be displayed: (1) G code list (2) Standard formats of G codes for a single block Displaying a G code list By displaying a list of G codes, you can search for G codes you may
- Page 53810.DISPLAY OPERATION B-63784EN-1/01 5. If the explanation spans multiple pages, pressing page keys PAGE PAGE displays the previous and next pages, respectively. 6. Write code as desired, referring to the standard format displayed in the help text. 7. After the entry to the key-in buffer ends and INP
- Page 539B-63784EN-1/01 OPERATION 10.DISPLAY 10.15.4 Moving the Cursor between the Ordinary Operation Screen and the Help Screen When a help screen is displayed and manipulated, the cursor is positioned to the help screen. It is, therefore, not possible to manipulate the cursor on the ordinary operation scre
- Page 54010.DISPLAY OPERATION B-63784EN-1/01 10.15.5 Notes NOTE 1 No help is displayed for the character card. 2 To execute the help function, the help system file must be loaded into flash ROM. 3 To update the help text, the help system file must be updated. When the CNC system file is updated, the help tex
- Page 541B-63784EN-1/01 OPERATION 10.DISPLAY 10.16 DIRECTORY DISPLAY / PUNCH FOR EACH GROUP General In addition to the conventional directory showing the names and numbers of the programs registered with the CNC, directories organized according to groups such as the objects to be machined can also be display
- Page 54210.DISPLAY OPERATION B-63784EN-1/01 (5) Enter a character string used in the names of the programs belonging to the group to search for, using the MDI keys. No limit is imposed on the number of characters in the program name; however, the system can search for only the first 48 characters of the pro
- Page 543B-63784EN-1/01 OPERATION 10.DISPLAY Operation - SEARCH Searches for programs. After the search, the system switches to the program text screen. (1) Click soft key [SEARCH]. (2) Key in the program number. (3) Click soft key [EXEC]. - PUNCH Punches the programs in the current group. There are several
- Page 54410.DISPLAY OPERATION B-63784EN-1/01 Explanation - Wildcard characters (* and ?) An asterisk (*) represents any character string, while a question mark (?) represents any one character. They, therefore, allow searches such as the following. Table 10.16 Examples of Using Wildcard Characters Character
- Page 545B-63784EN-1/01 OPERATION 10.DISPLAY 10.17 PROGRAM NAME 48 CHARACTERS General On the program directory screen, up to 48 characters of each program name (comment) can be displayed. (Conventionally, up to 16 characters) Program searches using program names are possible with the following operations: -
- Page 54610.DISPLAY OPERATION B-63784EN-1/01 Operation - ID SEARCH Searches for programs using a program name. After the search, the system switches to the program text screen. (1) Click soft key [ID SEARCH]. The soft keys change as follows: (2) Click soft key [(NAME)]. (3) Enter the character string used in
- Page 547B-63784EN-1/01 OPERATION 10.DISPLAY Explanation - Wildcard characters (* and ?) An asterisk (*) represents any character string, and a question mark (?) represents any one character. They therefore allow searches such as the following. Table 10.18 Examples of Using Wildcard Characters Character Prog
- Page 54810.DISPLAY OPERATION B-63784EN-1/01 10.18 FINE TORQUE SENSING Overview The CNC stores the disturbance torque data detected by a servo motor or spindle motor to internal memory. The following manipulations are possible for the stored torque data. 1. Stored torque data can be displayed as a graph on t
- Page 549B-63784EN-1/01 OPERATION 10.DISPLAY 2 About 34.9 About 69.9 About 139.8 minutes minutes minutes 3 or 4 About 17.4 About 34.9 About 69.9 minutes minutes minutes NOTE 1 The disturbance load torque data is represented as a percentage of the rated torque. 2 If the sample data preservation function is en
- Page 55010.DISPLAY OPERATION B-63784EN-1/01 Displaying a torque graph Torque graph screen Stored torque data can be graphed on the torque graph screen. On the torque graph screen, you can save data as sample data or output the latest data onto a memory card. You can also change the threshold value of the ab
- Page 551B-63784EN-1/01 OPERATION 10.DISPLAY At the left end of the horizontal axis, the time at the graph origin that has elapsed since the start of store operation is indicated, and the scale on the horizontal axis indicates the time from the graph origin. The values of the origins of the vertical axis and
- Page 55210.DISPLAY OPERATION B-63784EN-1/01 (B) Number of valid axes The number of valid axes for store operation is indicated. (C) Store cycle The store cycle is indicated in milliseconds. (D) Detection level If single-axis display mode is set, and bit 4 (ATL) of parameter No. 4660 is 1, the threshold valu
- Page 553B-63784EN-1/01 OPERATION 10.DISPLAY Operation - Selecting an axis to be displayed From the target axes (set in parameter Nos. 4670 to 4673), select an axis to be displayed. Press the soft key [SELECT AXIS], then press the soft key [ALL AXES], [1ST AXIS], [2ND AXIS], [3RD AXIS], or [4TH AXIS] to sele
- Page 55410.DISPLAY OPERATION B-63784EN-1/01 - Expanding, reducing, and moving time You can expand and reduce the time (horizontal axis) and can move the origin. When the soft key [EXPAND] or [REDUCE] is pressed, the period of time per graduation changes to 32 ms, 64 ms, 128 ms, 0.25 sec, 0.5 sec, 1 sec, 2.5
- Page 555B-63784EN-1/01 OPERATION 10.DISPLAY Parameter setting Torque parameter screen The parameters for the fine torque sensing function can be set on the torque parameter screen. On the torque graph screen, pressing the soft key [PARAMETER] displays the torque parameter screen. The torque parameter screen
- Page 55610.DISPLAY OPERATION B-63784EN-1/01 - Cycle The cycle for storing data is set. Select the cycle from 8 ms, 16 ms, and 32 ms. The setting is written in bits 0 and 1 (TQ1 and TQ2) of parameter No. 4660. - Axis setting The fine torque sensing function allows data for four axes to be stored. The axis nu
- Page 557B-63784EN-1/01 OPERATION 10.DISPLAY - Inputting a value When setting a value for AXIS SETTING, follow the steps explained below. Method 1 (1) Press the soft key [INPUT]. (2) Enter the value you want to set. (3) Press the soft key [EXEC]. Method 2 (1) Enter the value you want to set. (2) Press the so
- Page 55810.DISPLAY OPERATION B-63784EN-1/01 Torque data input/output The following explains procedures for outputting stored torque data onto a memory card and inputting output data to the CNC. - Torque data output procedure Method 1 (when neither output file nor file number is specified) (1) Press the soft
- Page 559B-63784EN-1/01 OPERATION 10.DISPLAY - Torque data input procedure Method 1 (when neither file name nor file number of an input file is specified) (1) Press the soft key [READ]. (2) Press the soft key [EXEC]. Method 2 (when an input file is specified with a file name) (1) Press the soft key [READ]. (
- Page 56010.DISPLAY OPERATION B-63784EN-1/01 10.19 2-LCD-UNIT CONNECTION FUNCTION Description Until now, it was only possible to display screens on a single LCD unit. By using this function, it is now possible to simultaneously display the same screen on two LCD units. Optical fiber cable 1st LCD 2nd LCD 1st
- Page 561B-63784EN-1/01 OPERATION 10.DISPLAY NOTE 3 If a card is inserted into the memory card interface of the first LCD unit after the system is switched to the second LCD unit, the system can be switched to the first LCD unit at a later time. In this case, the memory card interface of the first LCD unit i
- Page 56210.DISPLAY OPERATION B-63784EN-1/01 10.20 αi SERVO AND SPINDLE INFORMATION SCREENS The ID information of each device to be connected to the αi servo spindle system is displayed on the CNC screen. See FANUC Series 15i/150i-MODEL B MAINTENANCE MANUAL (B-63785EN) for details. - 540 -
- Page 563B-63784EN-1/01 OPERATION 11.CLEARING THE SCREEN 11 CLEARING THE SCREEN - 541 -
- Page 56411.CLEARING THE SCREEN OPERATION B-63784EN-1/01 11.1 CLEARING THE SCREEN Displaying the same characters in the same positions on the screen causes a LCD to degrade relatively quickly. To help prevent this, the screen can be cleared by pressing specific keys. It is also possible to specify the automa
- Page 565B-63784EN-1/01 OPERATION 11.CLEARING THE SCREEN 11.1.2 Automatic Erase Screen Display The CNC screen is automatically cleared if no keys are pressed during the period (in minutes) specified with a parameter. The screen is restored by pressing any key. Automatic erase screen display - Clearing the sc
- Page 56612.INPUTTING/OUTPUTTING DATA OPERATION B-63784EN-1/01 12 INPUTTING/OUTPUTTING DATA Information written on floppy disks, NC tape, and memory cards can be loaded into the CNC, using the memory card slot or an external input/output unit such as the Handy File. Information can also be written to these m
- Page 567B-63784EN-1/01 OPERATION 12.INPUTTING/OUTPUTTING DATA 12.1 FILES Of the external input/output devices, the FANUC Handy File and FANUC Floppy Cassette use floppy disks as their input/output medium, and the FANUC FA Card uses an FA card as its input/output medium. In this manual, these input/output me
- Page 56812.INPUTTING/OUTPUTTING DATA OPERATION B-63784EN-1/01 Since floppy replacement is processed by the input/output device, no special operation is required. The CNC will interrupt data input/ output operation until the next floppy is inserted into the adapter. When reset operation is applied to the CNC
- Page 569B-63784EN-1/01 OPERATION 12.INPUTTING/OUTPUTTING DATA 12.2 SPECIFYING PARAMETERS REQUIRED FOR INPUT/OUTPUT Follow the procedure described below to specify the parameters related to communication: (1) On the setting parameter screen, enable parameter writing. (2) On the communication setting screen,
- Page 57012.INPUTTING/OUTPUTTING DATA OPERATION B-63784EN-1/01 12.2.2 Communication Setting Screen On this screen, specify the parameters related to communication. Display Follow either of the procedures described below to display the communication setting screen: Method 1 Press the OFFSET SETTING function k
- Page 571B-63784EN-1/01 OPERATION 12.INPUTTING/OUTPUTTING DATA Item name Parameter Option (parameter setting) TV CHECK TVC(No.0000#0) ON (1)/OFF (0) TV (COMMENT) CTV(No.0000#1) ON (0)/OFF (1) IN/OUT CODE ISP(No.0000#2) EIA (#2=0/1 ,#4 =1) EIA(No.0000#4) ISO (#2=0 ,#4 =0) ASCII (#2=1 ,#4 =0) EOB CODE NCR(No.0
- Page 57212.INPUTTING/OUTPUTTING DATA OPERATION B-63784EN-1/01 NOTE 1 For channels for which device numbers (parameters Nos. 5001 to 5003 and 5013) are not set, the following default parameter sets are selected: RS232C CHANEL 1: Parameter set 1 (Nos. 5110, 5111, and 5112) RS232C CHANEL 2: Parameter set 2 (No
- Page 573B-63784EN-1/01 OPERATION 12.INPUTTING/OUTPUTTING DATA 12.3 INPUTTING AND OUTPUTTING PROGRAMS 12.3.1 Outputting Programs The following explains the operation for outputting the programs registered in the memory of the CNC to a floppy disk. Setup for output (1) Select EDIT mode. (2) Follow either of t
- Page 57412.INPUTTING/OUTPUTTING DATA OPERATION B-63784EN-1/01 Outputting a specified single program -Neither the input file name nor number need be specified Method 1 (1) Press the [PUNCH] soft key. (2) Press the [(PROGRAM#)] soft key. (3) Enter a program number. (4) Press the [EXEC] soft key. Method 2 (1)
- Page 575B-63784EN-1/01 OPERATION 12.INPUTTING/OUTPUTTING DATA - Specified with its file number Method 1 (1) Press the [PUNCH] soft key. (2) Press the [(FILE#)] soft key. (3) Enter a file number. (4) Press the [(PROGRAM#)] soft key. (5) Enter a program number. (6) Press the [EXEC] soft key. Method 2 (1) Pres
- Page 57612.INPUTTING/OUTPUTTING DATA OPERATION B-63784EN-1/01 Method 2 (1) Press the [PUNCH] soft key. (2) Press the O address key. (3) Enter the number of the first program to be output. (4) Press the , address key. (5) Press the O address key. (6) Enter the number of the last program to be output. (7) Pre
- Page 577B-63784EN-1/01 OPERATION 12.INPUTTING/OUTPUTTING DATA - Specified with its file number Method 1 (1) Press the [PUNCH] soft key. (2) Press the [(FILE#)] soft key. (3) Enter a file number. (4) Press the [(PROGRAM#)] soft key. (5) Enter the number of the first program to be output. (6) Press the [,(PRO
- Page 57812.INPUTTING/OUTPUTTING DATA OPERATION B-63784EN-1/01 (3) Enter a file name. (4) Press the [FILE NAME"] soft key. (5) Press the [ALL] soft key. Method 3 (Specified with its file number (one of two methods)) (1) Press the [PUNCH] soft key. (2) Press the [(FILE#)] soft key. (3) Enter a file number. (4
- Page 579B-63784EN-1/01 OPERATION 12.INPUTTING/OUTPUTTING DATA 12.3.2 Program Inputting The following explains the operation for inputting the programs to the memory of the CNC to a floppy disk. Setup for input (1) Select EDIT mode. (2) Follow either of the procedures described below to display the Program T
- Page 58012.INPUTTING/OUTPUTTING DATA OPERATION B-63784EN-1/01 Registering a program with a new program number - Methods in which neither the input file name nor number need be specified Method 1 (1) Press the [READ] soft key. (2) Press the [(PROGRAM#)] soft key. (3) Enter a program number. (4) Press the [EX
- Page 581B-63784EN-1/01 OPERATION 12.INPUTTING/OUTPUTTING DATA Method 2 (1) Press the [READ] soft key. (2) Press N the address key. (3) Enter a file number. (4) Press O the address key. (5) Enter a program number. (6) Press the [EXEC] soft key. Method 3 (1) Press N the address key. (2) Enter a file number. (
- Page 58212.INPUTTING/OUTPUTTING DATA OPERATION B-63784EN-1/01 Registering additional programs Method 1 (Neither the input file name nor number need be specified) (1) Press the [READ] soft key. (2) Press the [1_PROGRAM] soft key. (3) Press the [ADD] soft key. Method 2 (The input file is specified with its fi
- Page 583B-63784EN-1/01 OPERATION 12.INPUTTING/OUTPUTTING DATA 12.4 INPUTTING AND OUTPUTTING SYSTEM PARAMETERS 12.4.1 Outputting System Parameters The following explains the operation for outputting the system parameters registered in the memory of the CNC to a floppy disk. Setup for output (1) Select MDI mo
- Page 58412.INPUTTING/OUTPUTTING DATA OPERATION B-63784EN-1/01 Method 5 (Specified with its file number (three of three methods)) (1) Press N the address key. (2) Enter a file number. (3) Press the [PUNCH] soft key. NOTE When method 1 (in which neither the output file name nor number need be specified), desc
- Page 585B-63784EN-1/01 OPERATION 12.INPUTTING/OUTPUTTING DATA 12.4.2 Inputting System Parameters The following explains the operation for inputting the system parameters to the memory of the CNC to a floppy disk. Setup for input (1) Select MDI mode. (2) Enter the emergency stop status. (3) Follow either of
- Page 58612.INPUTTING/OUTPUTTING DATA OPERATION B-63784EN-1/01 12.5 INPUTTING AND OUTPUTTING TOOL OFFSET DATA 12.5.1 Outputting Tool Offset Data The following explains the operation for outputting the tool offset data registered in the memory of the CNC to a floppy disk. Setup for output (1) Select MDI mode.
- Page 587B-63784EN-1/01 OPERATION 12.INPUTTING/OUTPUTTING DATA Method 5 (Specified with its file number (three of three methods)) (1) Press the N address key. (2) Enter a file number. (3) Press the [PUNCH] soft key. NOTE When method 1 (in which neither the output file name nor number need be specified), desc
- Page 58812.INPUTTING/OUTPUTTING DATA OPERATION B-63784EN-1/01 12.5.2 Inputting Tool Offset Data The following explains the operation for inputting the tool offset data to the memory of the CNC to a floppy disk. Setup for input (1) Select MDI mode. (2) Follow either of the procedures described below to displ
- Page 589B-63784EN-1/01 OPERATION 12.INPUTTING/OUTPUTTING DATA 12.6 INPUTTING AND OUTPUTTING WORKPIECE ZERO POINT OFFSET DATA 12.6.1 Outputting Workpiece zero point offset data The following explains the operation for outputting the Workpiece zero point offset data registered in the memory of the CNC to a fl
- Page 59012.INPUTTING/OUTPUTTING DATA OPERATION B-63784EN-1/01 Method 5 (Specified with its file number (three of three methods)) (1) Press the N address key. (2) Enter a file number. (3) Press the [PUNCH] soft key. NOTE When method 1 (in which neither the output file name nor number need be specified), desc
- Page 591B-63784EN-1/01 OPERATION 12.INPUTTING/OUTPUTTING DATA 12.6.2 Inputting System Parameters The following explains the operation for inputting the Workpiece zero point offset data to the memory of the CNC to a floppy disk. Setup for input (1) Select MDI mode. (2) Follow either of the procedures describ
- Page 59212.INPUTTING/OUTPUTTING DATA OPERATION B-63784EN-1/01 12.7 INPUTTING AND OUTPUTTING CUSTOM MACRO VARIABLE 12.7.1 Outputting Custom Macro Variable The following explains the operation for outputting the Custom macro variable registered in the memory of the CNC to a floppy disk. Setup for output (1) S
- Page 593B-63784EN-1/01 OPERATION 12.INPUTTING/OUTPUTTING DATA Method 5 (Specified with its file number (three of three methods)) (1) Press the N address key. (2) Enter a file number. (3) Press the [PUNCH] soft key. NOTE When method 1 (in which neither the output file name nor number need be specified), desc
- Page 59412.INPUTTING/OUTPUTTING DATA OPERATION B-63784EN-1/01 12.7.2 Inputting Custom Macro Variable The following explains the operation for inputting the Custom macro variable to the memory of the CNC to a floppy disk. Setup for input (1) Select MDI mode. (2) Follow either of the procedures described belo
- Page 595B-63784EN-1/01 OPERATION 12.INPUTTING/OUTPUTTING DATA 12.8 INPUTTING AND OUTPUTTING THREE-DIMENSIONAL ERROR COMPENSATION DATA 12.8.1 Outputting Three-dimensional Error Compensation Data The following explains the operation for outputting the Three- dimensional error compensation data registered in t
- Page 59612.INPUTTING/OUTPUTTING DATA OPERATION B-63784EN-1/01 Method 5 (Specified with its file number (three of three methods)) (1) Press the N address key. (2) Enter a file number. (3) Press the [PUNCH] soft key. NOTE When method 1 (in which neither the output file name nor number need be specified), desc
- Page 597B-63784EN-1/01 OPERATION 12.INPUTTING/OUTPUTTING DATA 12.8.2 Inputting Three-dimensional Error Compensation Data The following explains the operation for inputting the Three- dimensional error compensation data to the memory of the CNC to a floppy disk. Setup for input (1) Select MDI mode. (2) Follo
- Page 59812.INPUTTING/OUTPUTTING DATA OPERATION B-63784EN-1/01 12.9 INPUTTING AND OUTPUTTING TOOL OFFSET DATA BY TOOL NUMBER 12.9.1 Outputting Tool Offset Data by Tool Number The following explains the operation for outputting the Tool offset data by tool number registered in the memory of the CNC to a flopp
- Page 599B-63784EN-1/01 OPERATION 12.INPUTTING/OUTPUTTING DATA Method 5 (Specified with its file number (three of three methods)) (1) Press the N address key. (2) Enter a file number. (3) Press the [PUNCH] soft key. NOTE When method 1 (in which neither the output file name nor number need be specified), desc
- Page 60012.INPUTTING/OUTPUTTING DATA OPERATION B-63784EN-1/01 12.9.2 Inputting Tool Offset Data by Tool Number The following explains the operation for inputting the Tool offset data by tool number to the memory of the CNC to a floppy disk. Setup for input (1) Select MDI mode. (2) Follow either of the proce
- Page 601B-63784EN-1/01 OPERATION 12.INPUTTING/OUTPUTTING DATA 12.10 INPUTTING AND OUTPUTTING FIXTURE OFFSET DATA 12.10.1 Outputting Fixture Offset Data The following explains the operation for outputting the fixture offset data registered in the memory of the CNC to a floppy disk. Setup for output (1) Selec
- Page 60212.INPUTTING/OUTPUTTING DATA OPERATION B-63784EN-1/01 Method 5 (Specified with its file number (three of three methods)) (1) Press the N address key. (2) Enter a file number. (3) Press the [PUNCH] soft key. NOTE When method 1 (in which neither the output file name nor number need be specified), desc
- Page 603B-63784EN-1/01 OPERATION 12.INPUTTING/OUTPUTTING DATA 12.10.2 Inputting Fixture Offset Data The following explains the operation for inputting the fixture offset data to the memory of the CNC to a floppy disk. Setup for input (1) Select MDI mode. (2) Follow either of the procedures described below t
- Page 60412.INPUTTING/OUTPUTTING DATA OPERATION B-63784EN-1/01 12.11 INPUTTING AND OUTPUTTING ROTARY HEAD DYNAMIC TOOL OFFSET DATA 12.11.1 Outputting Rotary Head Dynamic Tool Offset Data The following explains the operation for outputting the Rotary head dynamic tool offset data registered in the memory of t
- Page 605B-63784EN-1/01 OPERATION 12.INPUTTING/OUTPUTTING DATA Method 5 (Specified with its file number (three of three methods)) (1) Press the N address key. (2) Enter a file number. (3) Press the [PUNCH] soft key. NOTE When method 1 (in which neither the output file name nor number need be specified), desc
- Page 60612.INPUTTING/OUTPUTTING DATA OPERATION B-63784EN-1/01 12.11.2 Inputting Rotary Head Dynamic Tool Offset Data The following explains the operation for inputting the Rotary head dynamic tool offset data to the memory of the CNC to a floppy disk. Setup for input (1) Select MDI mode. (2) Follow either o
- Page 607B-63784EN-1/01 OPERATION 12.INPUTTING/OUTPUTTING DATA 12.12 OUTPUTTING SYSTEM CONFIGURATION DATA 12.12.1 Outputting System Configuration Data The following explains the operation for outputting the system configuration data registered in the memory of the CNC to a floppy disk. Setup for output (1) S
- Page 60812.INPUTTING/OUTPUTTING DATA OPERATION B-63784EN-1/01 Method 5 (Specified with its file number (three of three methods)) (1) Press the N address key. (2) Enter a file number. (3) Press the [PUNCH] soft key. NOTE When method 1 (in which neither the output file name nor number need be specified), desc
- Page 609B-63784EN-1/01 OPERATION 12.INPUTTING/OUTPUTTING DATA 12.13 INPUTTING AND OUTPUTTING DATA USING THE FLOPPY DIRECTORY SCREEN Usually, it is necessary to switch to the appropriate screen depending on the type of data to be input/output (for example, the Parameter screen to output and input parameters
- Page 61012.INPUTTING/OUTPUTTING DATA OPERATION B-63784EN-1/01 12.14 INPUTTING AND OUTPUTTING DATA USING THE MEMORY CARD SCREEN Usually, it is necessary to switch to the appropriate screen depending on the type of data to be input/output (for example, the Parameter screen to output and input parameters to an
- Page 611B-63784EN-1/01 OPERATION 12.INPUTTING/OUTPUTTING DATA 12.15 EXTERNAL I/O EQUIPMENT CONTROL It is possible to instruct in registration/the output of the program from the outside. - Registration The program is registered in the program memory by using the edit function from the external input equipmen
- Page 61212.INPUTTING/OUTPUTTING DATA OPERATION B-63784EN-1/01 12.16 SCREEN HARD COPY FUNCTION The screen hard copy function converts screen information displayed on the CNC to 640 x 480 dot bit map data, and outputs the resulting data to a memory card. The output bit map data can be displayed and edited on
- Page 613B-63784EN-1/01 OPERATION 12.INPUTTING/OUTPUTTING DATA If the screen hard copy function is executed after "HDCPY999.BMP" has been output, the file name returns to "HDCPY00.BMP." If, however, the name of the file output when the screen hard copy function is executed is the same as that of a file on th
- Page 61413.AXIS CONTROL OPERATION B-63784EN-1/01 13 AXIS CONTROL - 592 -
- Page 615B-63784EN-1/01 OPERATION 13.AXIS CONTROL 13.1 AXIS CONTROL BY THE PMC Any axes can be isolated from control of the CNC and controlled directly by the PMC. The PMC can issue commands specifying a traveled distance, feedrate, and so forth to move the tool along these axes independently of the other ax
- Page 61613.AXIS CONTROL OPERATION B-63784EN-1/01 13.2 MIRROR IMAGE During automatic operation, the mirror image function can be used for movement along an axis. To use this function, set the setting parameter MIR (hit 0 of No.0012) mirror image switch to ON on the machine operator's panel, or set the mirror
- Page 617B-63784EN-1/01 OPERATION 13.AXIS CONTROL Limitation The direction of movement during manual operation, the direction of movement from an intermediate point to the reference position during automatic reference position return (G28), the direction of approach during unidirectional positioning (G60), a
- Page 61813.AXIS CONTROL OPERATION B-63784EN-1/01 Y Machine movement after mirror image Move command (Automatic operation) Absolute coordinate when mirror image is started Absolute coordinate after mirror image on Work coordinate system shift value Origin of work coordinate system Work offset value X Fig13.2
- Page 619B-63784EN-1/01 OPERATION 14.ABSOLUTE-POSITION DETECTION 14 ABSOLUTE-POSITION DETECTION On an axis equipped with an absolute pulse coder, the machine position is monitored even when the CNC power is turned off, so return to the reference position is unnecessary when the power is turned on again. An a
- Page 62014.ABSOLUTE-POSITION DETECTION OPERATION B-63784EN-1/01 (3) Return to the reference position manually. When tool reaches the reference position, parameter APZ is automatically set to 1. (4) Press the reset button. Alarm OT32 is then released. - Setting the origin with MDI operation When an absolute
- Page 621B-63784EN-1/01 OPERATION 14.ABSOLUTE-POSITION DETECTION - Alarm The following alarms may be detected when the power is turned on. Number Message Contents OT0032 NEED ZRN(ABS PCDR) The reference position and the absolute pulse coder counter value do not match. OT0034 BATTERY ZERO(ABS PCDR) The batter
- Page 622
- Page 623III MAINTENANC
- Page 624
- Page 625B-63784EN-1/01 MAINTENANCE 1.INVESTIGATION OF TROUBLE GENERATION SITUATION 1 INVESTIGATION OF TROUBLE GENERATION SITUATION - 603 -
- Page 6261.INVESTIGATION OF TROUBLE GENERATION SITUATION MAINTENANCE B-63784EN-1/01 1.1 DISPLAY OF SYSTEM CONFIGURATION SCREEN It is a screen to display software and a hardware configuration necessary for maintaining CNC. Display of system configuration screen The system configuration screen includes three k
- Page 627B-63784EN-1/01 MAINTENANCE 1.INVESTIGATION OF TROUBLE GENERATION SITUATION - Software configuration screen Fig. 1.1 (b) Software configuration screen - Module configuration screen Fig. 1.1 (c) Module configuration screen - Content of display Refer to FANUC Series 15i/150i-MODEL B Maintenance Manual
- Page 6281.INVESTIGATION OF TROUBLE GENERATION SITUATION MAINTENANCE B-63784EN-1/01 1.2 SYSTEM LOG SCREEN When a system alarm is issued, displayed information is recorded in backup memory. The recorded information can then be checked and downloaded to a memory card and host computer even after the machine is
- Page 629B-63784EN-1/01 MAINTENANCE 1.INVESTIGATION OF TROUBLE GENERATION SITUATION Outputting a system log Method 1 (when neither an output file name nor file number is specified) (1) Press the [PUNCH] soft key. (2) Press the [LOG (NEW)], [LOG (OLD)], [ALL], or [THIS DATA] soft key. Method 2 (when an output
- Page 6301.INVESTIGATION OF TROUBLE GENERATION SITUATION MAINTENANCE B-63784EN-1/01 1.2.1 Displaying the Contents of Memory The CNC memory contents, starting from a specified address, can be displayed. For details, refer to the "FANUC Series 15i/150i-MODEL B Maintenance Manual" (B-63785EN). NOTE This screen
- Page 631APPENDI
- Page 632
- Page 633B-63784EN-1/01 APPENDIX A.STATUS WHEN TURNING POWER ON, WHEN RESET A STATUS WHEN TURNING POWER ON, WHEN RESET Parameter CLR (No. 3402#6) is used to select whether resetting the CNC places it in the reset state (0: reset state). The symbols in the tables below mean the following: O : The status is no
- Page 634A.STATUS WHEN TURNING POWER ON, WHEN RESET APPENDIX B-63784EN-1/01 Item When turning Reset power on ALM Extinguish if there is no cause for the Extinguish if there is no cause for the Status alarm alarm display LSK light light Output Reference position return X O signals completion LED ZPn S, T code
- Page 635B-63784EN-1/01 INDEX INDEX Control Point Compensation in Three-dimensional Handle
Feed .......................................................................................99 2-LCD-UNIT CONNECTION FUNCTION........................538 COORDINATE SYSTEM RELATED DATA DISPLAY...214 9.5"/10.4" - Page 636INDEX B-63784EN-1/01 DISPLAYING PULSE VALUES AND AMOUNT OF HELP FUNCTION ..............................................................510 MOVEMENT BY MANUAL INTERRUPT.......................110 Help Menu ...........................................................................511 Displaying the Co
- Page 637B-63784EN-1/01 INDEX INVESTIGATION OF TROUBLE GENERATION OPERATION SCREEN DISPLAY.......................................42 SITUATION ........................................................................603 OPERATIONAL DEVICES..................................................34 OPERATIONS SUPPORTE
- Page 638INDEX B-63784EN-1/01
TESTING A PROGRAM ......................................................18 Replacing Addresses............................................................268 THREE-DIMENSIONAL HANDLE FEED..........................87 Replacing Words and Character Strings ..................... - Page 639Revision Record FANUC Series 15i/150i-MB OPERATOR’S MANUAL (OPERATION) (B-63784EN-1) 01 Jan., 2002 Edition Date Contents Edition Date Contents
- Page 640